A “Leads Created per ‘x’ time period” report reveals the number of leads generated within a specified time frame.
Leads are an important part of the sales and marketing process, as they represent potential customers who have already shown some level of interest in the company’s offerings by providing their contact information. By effectively nurturing leads and building a relationship with them, companies can increase their chances of converting those leads into paying customers.
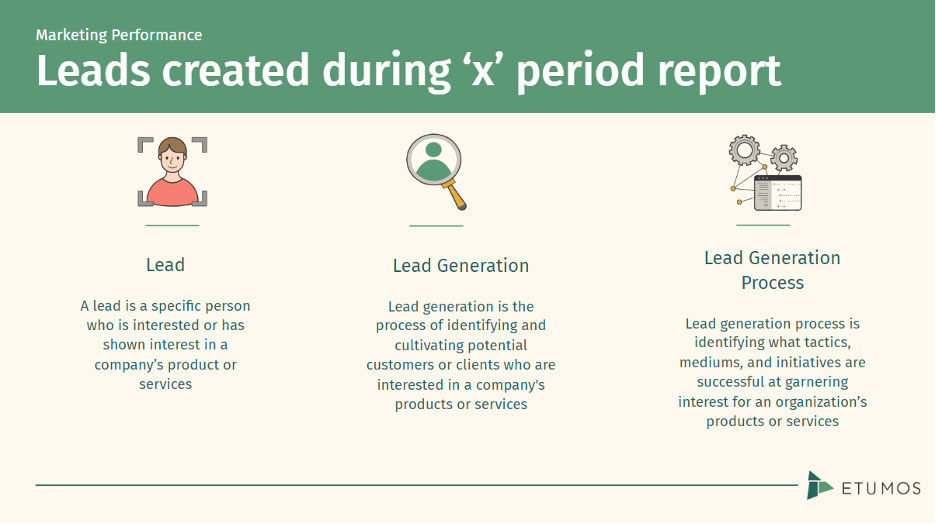
This report can be helpful for understanding the effectiveness of marketing campaigns, sales efforts, or lead-generation activities. Ultimately it evaluates the effectiveness of campaigns and initiatives to increase interest and awareness of an organization’s products and services. By being more effective at generating interest and awareness, an organization can increase its pool of prospects that turn into customers.
For example, a marketing team might use this report to track the number of leads generated from a particular advertising campaign over a month. The team can then compare this to the number of leads generated from other campaigns to determine which campaigns are most effective.
To create a “Leads Created per ‘x’ time period” report, the following data is typically needed:
- The time period for which the report is being generated (e.g. daily, weekly, monthly, quarterly)
- Type: Datetime field
- The date and time of each lead creation event
- Type: Datetime field
- The source of the lead (e.g. website form, trade show, referral)
-
- UTM strategy
- Type: string
- Campaign/Program naming strategy
- Type: string
- UTM strategy
-
- Any relevant demographic or firmographic information about the lead (e.g. industry, company size, job title)
- Type: pick-list when possible to help with data quality
With this data, a report can be generated to show the total number of leads created within the specified time period, as well as a breakdown of where those leads came from and any relevant demographic information. This information can then be used to make informed decisions about marketing and sales strategies.
How to pull the data using Google Analytics 4 (GA4)
All screenshots are taken through the GA4 Demo Account.
In GA4 we define a lead as a unique visitor who has provided their contact information (filled out a form) for the first time. This differs from a generic GA4 user who can be anonymous (meaning they haven’t provided contact information). So, we are focusing on specific events that result in a form-fill for the first time, over a period of time.
Splicing the report in GA4 by acquisition information does require that your organization has a SCRIM (scalable, clear, robust, intelligent, and modular) process so that the data is trustworthy and understandable.
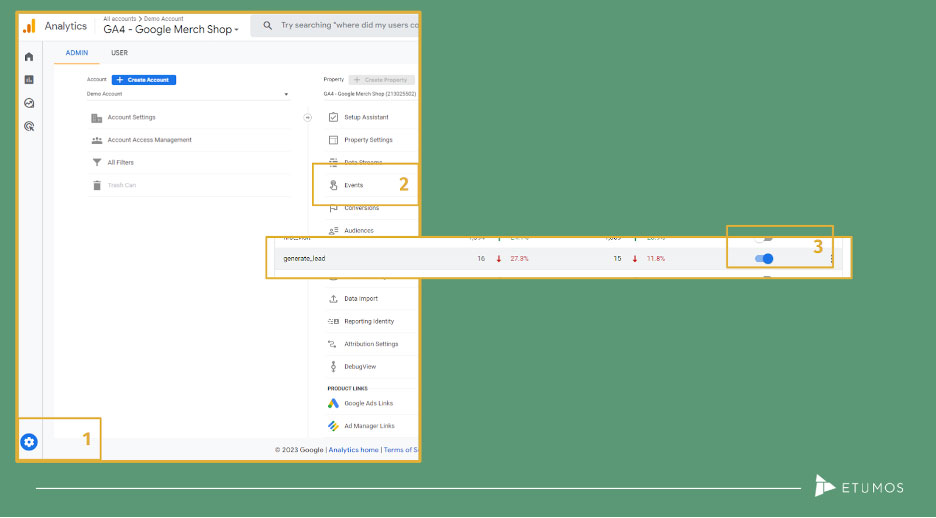
Create an event or conversion event (admin)
The first step for lead generation tracking GA4 is to activate the ‘generate_lead’ event. This is an out-of-the-box event supplied with the platform and looks for someone to submit a form on your site.
- Select ‘admin’ in the bottom left-hand corner
- Select ‘event’s in the list of options under the property settings
- Ensure the toggle is switched to blue for ‘generate_lead’
- If you do not see ‘generate_lead’ as an option, you will need to create a new event.
- Follow the GA4 directions found here for event creation.
Once that is completed, your organization will be able to use that event as a filter in your reporting view.
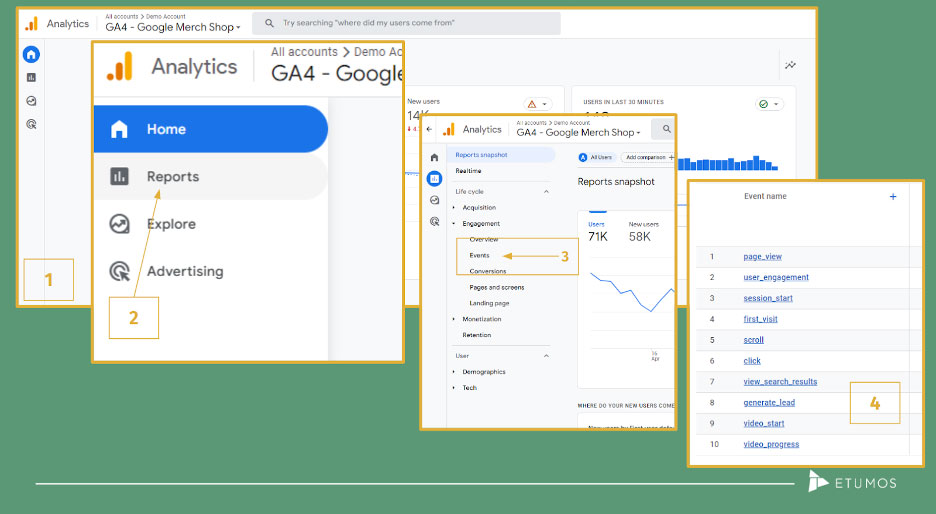
Reporting on leads generated
- Navigate to the reports tab on the left-hand side of the screen
- Select the drop-down for ‘Engagement’
- Select ‘events’
- Within the event’s report, you can select the ‘generate_lead’ option that is listed under the ‘event name’ text chart to filter to that specific event. This will automatically transfer the view to only review that specific event
Pulling specific timeframes
After you have your event report filtered down, there are a few options for the data range. Your team can either pull the data for a specific time period:
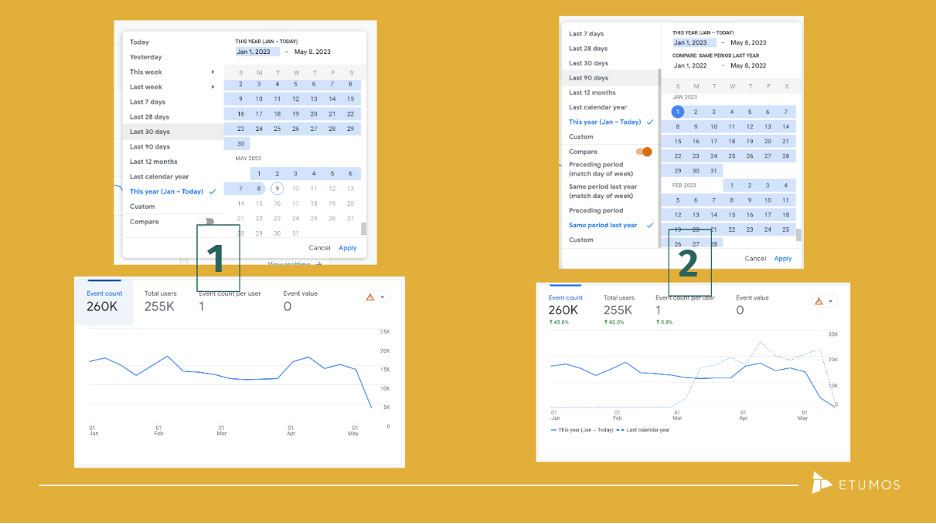
Leads generated per Year
- Ensure your event is created in the admin section
- Filter to the ‘generate_ lead’ or custom event that tracks the lead generation activity
- Select the date filter in the top right-hand corner
- Select the year filter
- To compare year over year (to identify if there are trends during similar time periods), toggle the compare button on and select ‘same period last year’
- The headers in the chart will show metrics related to the current year, but the chart will show a dotted line for the previous year’s comparison
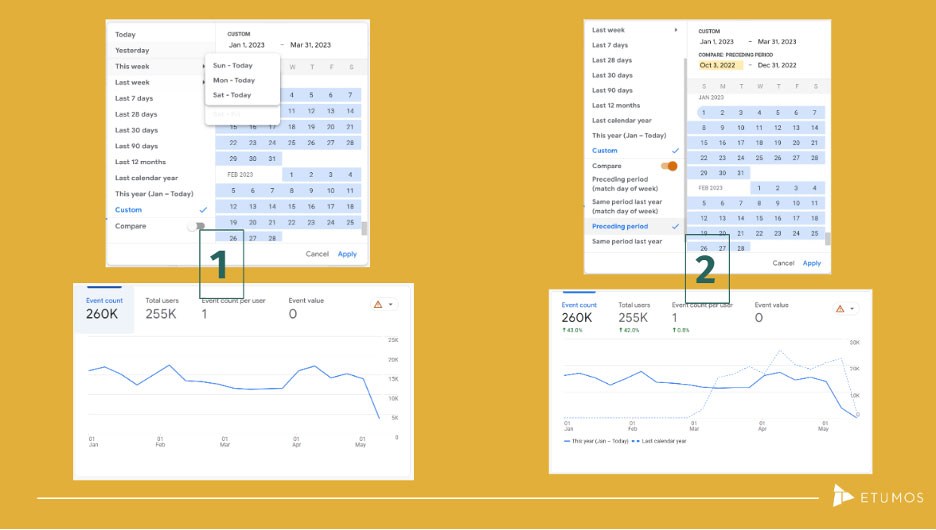
Leads generated per Quarter
- Ensure your event is created in the admin section
- Filter to the ‘generate_ lead’ or custom event that tracks the lead generation activity
- Select the date filter in the top right-hand corner
- Select custom, as ‘quarter’ is not an option
- Select the custom date range that matches the quarter range your team is looking for
- To compare quarter over quarter (to identify if there are trends during similar time periods), toggle the compare button on and select ‘preceding period’
- The headers in the chart will show metrics related to the current date range, but the chart will show a dotted line for the previous quarter’s comparison
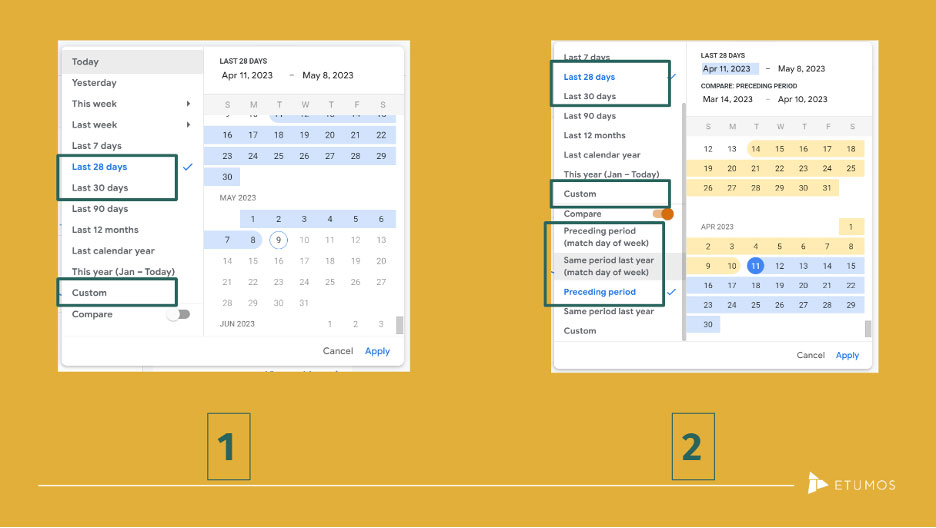
Leads generated per Month
- Ensure your event is created in the admin section
- Filter to the ‘generate_ lead’ or custom event that tracks the lead generation activity
- Select the date filter in the top right-hand corner
- Select custom, as ‘quarter’ is not an option
- Select the custom date range that matches the quarter range your team is looking for
- To compare month over month (to identify if there are trends during similar time periods), toggle the compare button on and select ‘preceding period’
- The headers in the chart will show metrics related to the current date range, but the chart will show a dotted line for the previous quarter’s comparison
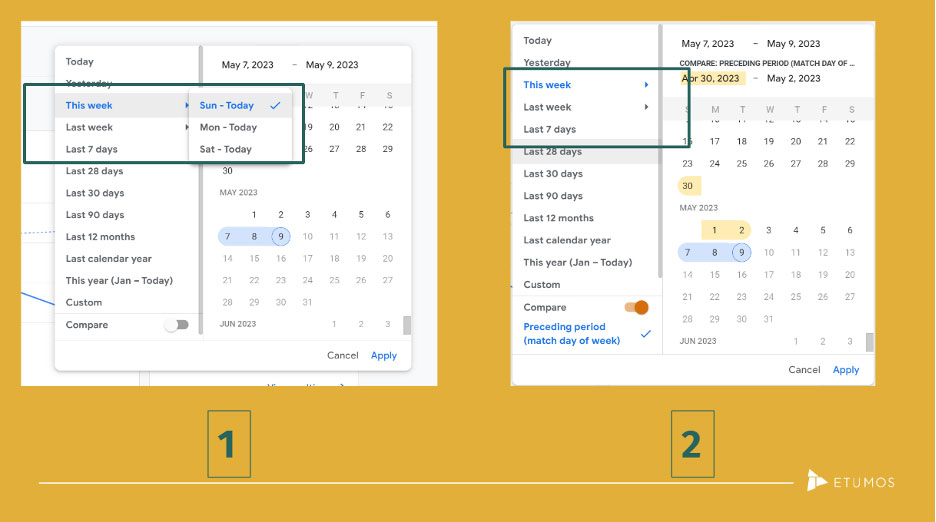
Leads generated per Weekday
- Ensure your event is created in the admin section
- Filter to the ‘generate_ lead’ or custom event that tracks the lead generation activity
- Select the date filter in the top right-hand corner
- Select the week date range that your organization would like to focus on and the start day:
- This week
- Last week
- Last 7 days
- Sunday start, Monday start, Saturday start
- To compare different 7-day periods, toggle the compare button on and select the appropriate comparison period
- The headers in the chart will show metrics related to the current date range, but the chart will show a dotted line for the previous quarter’s comparison
How to pull the data using Salesforce
All screenshots are taken through the Salesforce Trial Developer account.
Pulling the data in SF is relatively simple, as many of the fields are captured with an out-of-the-box setup. The difference with a Salesforce report is that there are a few additional custom fields and processes for your data that will need to be established for splicing and dicing the data (discussed above).
A salesforce lead is a prospect who has not previously purchased a product or service and is not associated with an account that has purchased a product or service but has shown interest.
Generating the report:
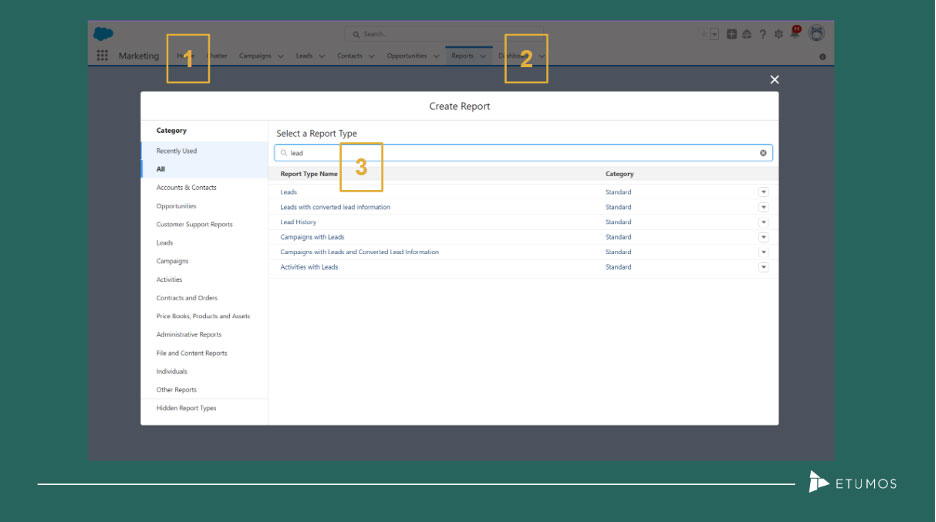
- Navigate to your marketing app in Salesforce
- Open up the report tab
- Select ‘new report’
- Search for a ‘leads’ report
- Select the report
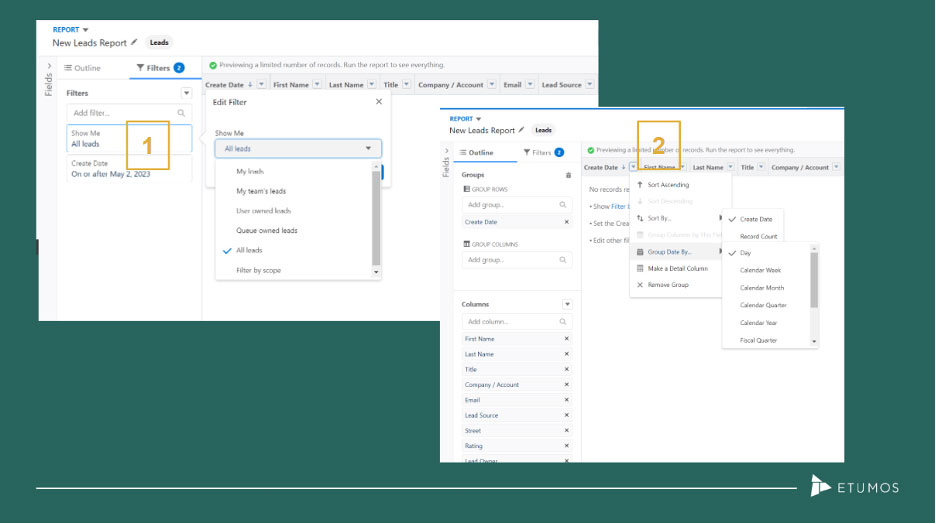
- Open up the filters
- Change show me to ‘all leads’
- Change to the appropriate date range
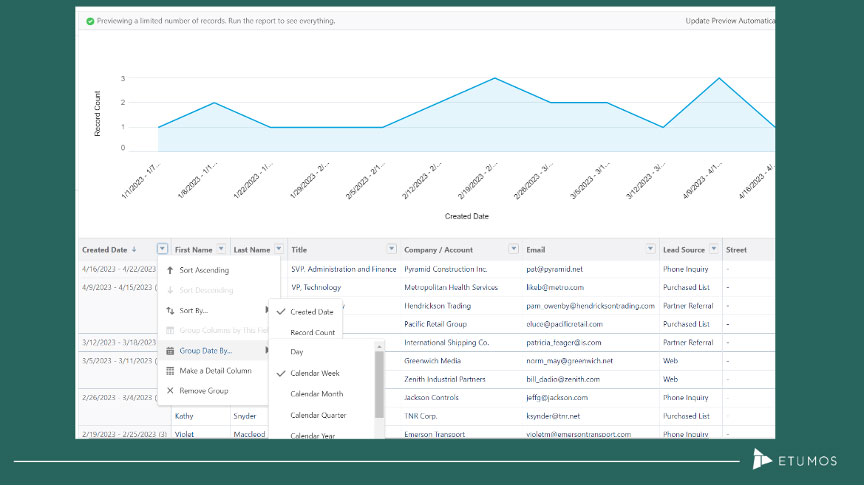
- Open up the outline
- Group by created date
- Select the drop-down arrow in the ‘create date’ grouping column and select ‘Group Date by’ and select the range group that matches your created date filter
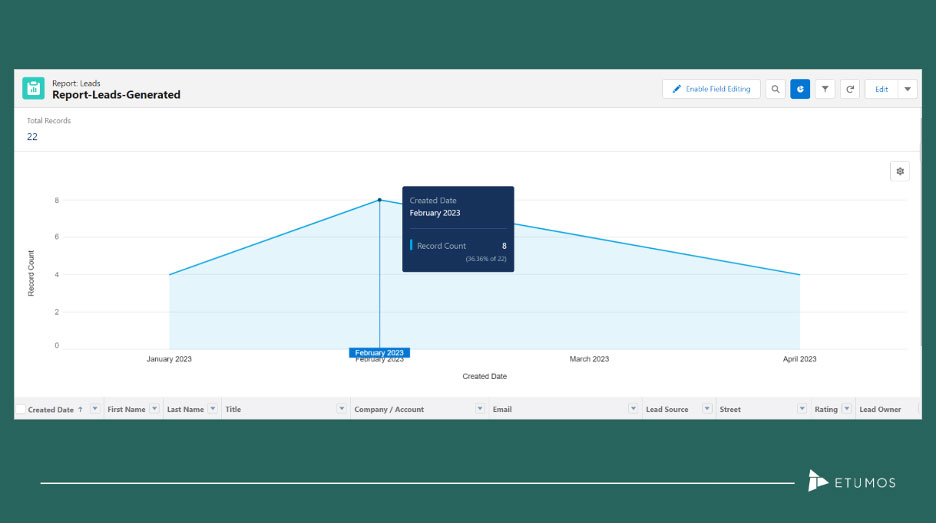
- Select ‘add chart’ to view the data visually as a line graph
Pulling specific timeframes:
Leads generated per Year
- Open the leads-generated report
- Select the ‘create date’ field in the filters tab and select the years that your team would like to compare by either selecting a date range or customizing the date range
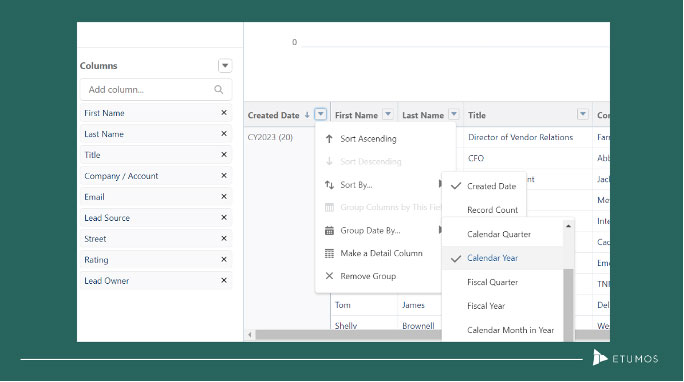
- Navigate to the outline tab:
- Select the create date column and change the ‘group date by’ to reference the year (either fiscal or current)
- This will change the view in your graph to show grouping by year
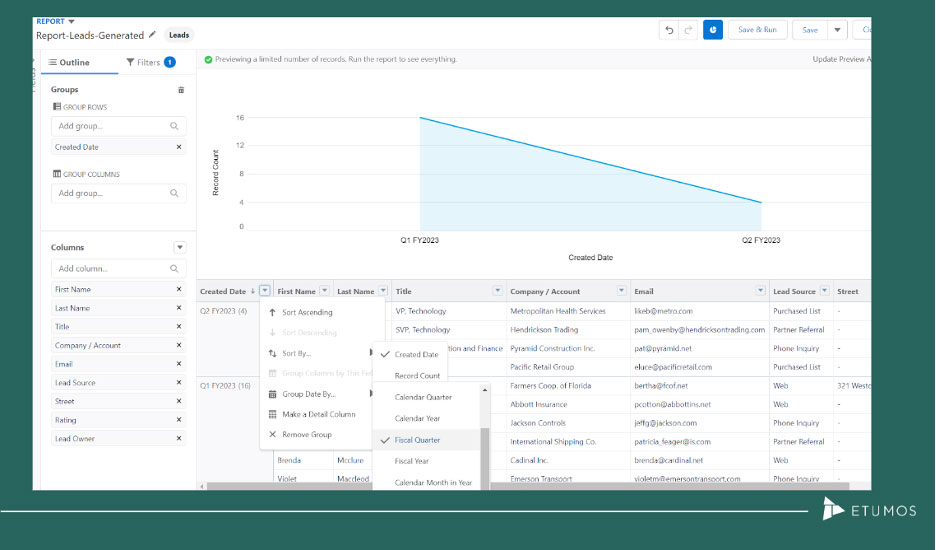
Leads generated per Quarter
- Open the leads-generated report
- Select the ‘create date’ field in the filters tab and select the quarters that your team would like to compare by either selecting a date range or customizing the date range
- Navigate to the outline tab:
- Select the create date column and change the ‘group date by’ to reference the quarter (either fiscal or current)
- This will change the view in your graph to show grouping by quarter
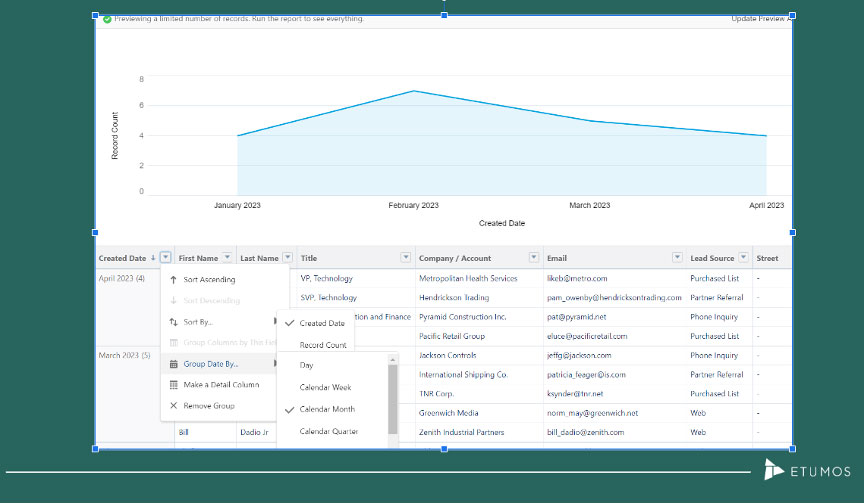
Leads generated per Month
- Open the leads-generated report
- Select the ‘create date’ field in the filters tab and select the months that your team would like to compare by either selecting a date range or customizing the date range
- Navigate to the outline tab:
- Select the create date column and change the ‘group date by’ to reference the month
- This will change the view in your graph to show grouping by month
Leads generated per Week
- Open the leads-generated report
- Select the ‘create date’ field in the filters tab and select the quarters that your team would like to compare by either selecting a date range or customizing the date range
- Navigate to the outline tab:
- Select the create date column and change the ‘group date by’ to reference the week
- This will change the view in your graph to show grouping by week