As Marketers, we are all familiar with the typical funnel KPIs. We implicitly know the importance of measuring the funnel and creating a robust lead lifecycle processing framework, but we often do not know how or where to start with our marketing lead reporting. Hint: The key is less in the actual KPIs, but rather how you slice them into meaningful views.
This brings us to Conversion Rate and Velocity, two KPIs you likely know and understand, but (like many of us) are having trouble either measuring in your systems or finding the right ways to leverage for marketing decision-making. When analyzed properly, they can give you valuable insights into things like lead quality and operational efficacy.
The most effective way to make use of Conversion and Velocity in your marketing lead reporting is through cohort analysis, which can be made possible by ensuring your leads are date-stamped whenever they reach key funnel stages. In the practice of Marketing Analytics, cohorts are typically time-bound, referring to a group of prospects that reach a certain funnel threshold in the same timeframe. Overlay the cohorts in a time series, and we can start identifying patterns in Conversion Rate, Velocity, and other key metrics. Patterns are what makes these KPIs useful for decision-making. Without the patterns, this is just more data collecting dust.
To illustrate this, let’s walk through a cohort scenario looking at how leads from specific channels perform at different funnel stages.
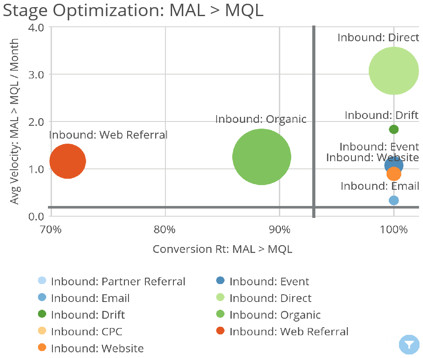
The chart above describes the Conversion Rate and Velocity of a cohort of Marketing Accepted Leads (AKA “Known”), broken down by Lead Source, as they move down the path of becoming Marketing Qualified Leads. The obvious initial takeaway is that “Inbound: Direct” performs exceedingly well at moving large volumes of prospects to MQL at a relatively high rate of ~3 MQLs per month. Tactics like Nurture and other channels of engagement obviously play a vital role as well, but for the sake of this exercise, let’s assume these other experiences are controlled and uniform across the board.
“Inbound: Event,” while converting just as well, is not bringing in as many MQLs and certainly not as quickly (averaging just over 1 MQL per month). This is typically when the web team will be patting themselves on the back for a job well done in driving MQLs… and they should, if MQLs is the ultimate goal.
However, despite the winning performance at the Top-of-Funnel, most good marketers know at least a few different ways to deliver leads, and even MQLs, all day long. Unfortunately, simply cramming more into the top of the funnel does not automatically translate into increased revenue and a happy Sales team.
- After all, there are plenty of channels (some slightly shady ones) where you can purchase lead lists or execute on cheap paid media channels to drive traffic and form fills. Purchased email lists, if not properly tagged, may even come through as “Inbound: Direct” in your Lead Source logic.
- As for MQLs, a minor tweak in the behavioral or demographics qualification criteria can often mean an explosive growth in the volume of MQLs “generated.”
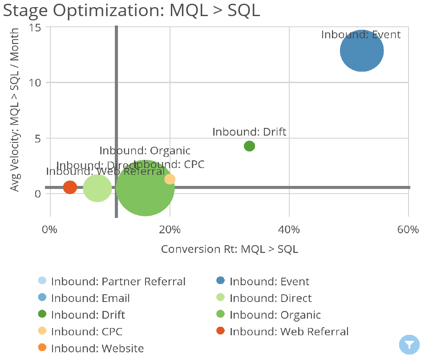
Following the performance of these same MAL cohorts, now MQLs, down-funnel (in the chart above) tells a slightly different story. As indicated by the MQL-to-SQL Conversion Rate, Sales apparently disagrees with Marketing’s assessment that “Inbound: Direct” leads are of high quality. Not only do they convert at a lower rate, but they do so at a much lower velocity as well. In fact, “Inbound: Direct,” at 16% conversion rate is just above the overall average, while moving only ~0.5 SQLs per month (which is actually slightly below average).
Instead, we now see that “Inbound: Event” MQLs are enjoying the highest conversion rates, highest velocity, and even a very respectable volume of prospects. So what are the key takeaways?
- First of all, don’t assume a good lead is “good” throughout all stages of the funnel, especially when it comes to stages where you have little to no control over the appraisal of these leads. Anytime you analyze your funnel, you need to have a clear sense of your “North Star,” and what “Conversion” you are optimizing for.
- Secondly, looking at Cohort Conversion Rates and Velocities through the right lenses enable you to discover patterns around prospect, as well as Marketing and Sales, behavior. It also allows you to answer some core questions around lead quality and potential operational deficiencies.
You probably realize by now, but this is not the end of your investigation. The point of this exercise is to illustrate how best to use Funnel Conversion Rates and Velocity to drive the next phase of your analysis or research by slicing the data by cohort. This will likely lead you to have deeper conversations with channel owners, Sales Operations, and Sales reps to determine why there is a disconnect between upper funnel performance and mid funnel performance for individual channels. Utilizing the right data can help you prioritize where to best spend your time to dive deeper.
If you’d like to know more about how Etumos can help you get more out of your data, contact us for a free 30 minute consultation.