Hand-Raiser: who they are and why they are important
Prospect: “Hey contact me. I want to learn more about your product”
Sales Rep: “Hi! Absolutely, it’s the best product out there”
Prospect: “I’m sold!”
Organization: Opportunity Closed/Won
We all wish that selling our products and services were that easy in real life. Unfortunately, it takes a little more finesse to pull in prospects for our sales reps. Fortunately for organizations, there are indicators and ways that teams can identify ‘hand-raisers’ and report on them more effectively to generate more over time.
A hand-raiser is a prospect who is evaluating your organization’s products or services and provides their contact information in exchange for a more personalized experience to gather insights on the product or service. A hand-raiser is incredibly valuable because they are indicating that they are ready or considering the purchasing process.
With data being easily accessible via a variety of mediums, prospects are able to gather a great deal of information about your brand and product or service before even interacting with your organization. Gartner estimates that only 17% of the buyer journey is spent with a sales rep and that it requires strategic and data-driven reports to understand the other 83% of the buyer journey.
This means that when they have actually raised their hand and indicated that they want to interact with your organization directly, your team needs to jump on the opportunity. It also means that a focus on data analysis of the buyer journey is more important than ever before to understand what brought the prospect to you, what information they have already received, and how your sales team can get them to the finish line.
What does the report reveal and tell us?
A hand-raiser report details how many prospects your organization has collected over a specific period of time. It can also display demographic and firmographic information to support the analysis of trends.
In order to set up a report, your team must identify the specific form-fill engagements that are consistent with the hand-raiser definition.
| Form Type Examples | Hand-raise (Y/N) | Explanation |
| Registration | N ♂️ |
Interest in the specific topic and considered part of the nurturing process to provide more information on why your product/service is useful. A hand-raiser form-fill could be sent as an option after the person engages with the webinar. |
| Demo Request | Y | The prospect is indicating that they would like to understand the product further, potentially the purchasing process and cost. |
| Contact Us | Potentially ♀️ |
Depending on what your contact form is connected to, this could indicate that a person wants to discuss your product or service further. |
| Trial Request | Y | This is a good indicator that a person is interested in your product and it’s important to have a nurture strategy in place to support a prospect’s learning and understanding of the product throughout their trial. |
Once you have the forms decided on, your team would strategize on what information should be presented or collected upon the form fill to support the sales rep in their discussions.
- UTM Data – understand what brought the person to the form and what content was consumed that resulted in the form-fill
- Account information – understand if the prospect is a right fit for your product or service and potentially identify the opportunity amount
- Date Collection – when the engagement occurred to look at form-fills over a period of time to see the ebb and flow of the data
- MTA capture – In more advanced reporting setups, having a multi-touch attribution system in place to understand the journey they took and other similar prospects too to influence that form-fill will help to paint a full picture vs. a last-touch capture.
Platform Report Building
Google Analytics 4 (GA4)
All screenshots are produced through the GA4 Demo account
Filling out a form is inherently an online engagement, meaning it’s happening on your website. This type of activity can be tracked in Google Analytics to analyze the interaction with more artistry.
The first step is generating a conversion specific for hand-raise form fill. A conversion is different from an event and more valuable because it identifies specific users that complete specific actions (not just visiting your site and filling out any form). By marking a hand-raiser as a conversion event, it allows you to focus your reporting efforts on that specific engagement.
- Admin
- Events – create an event
- Toggle the button under ‘mark as conversion’
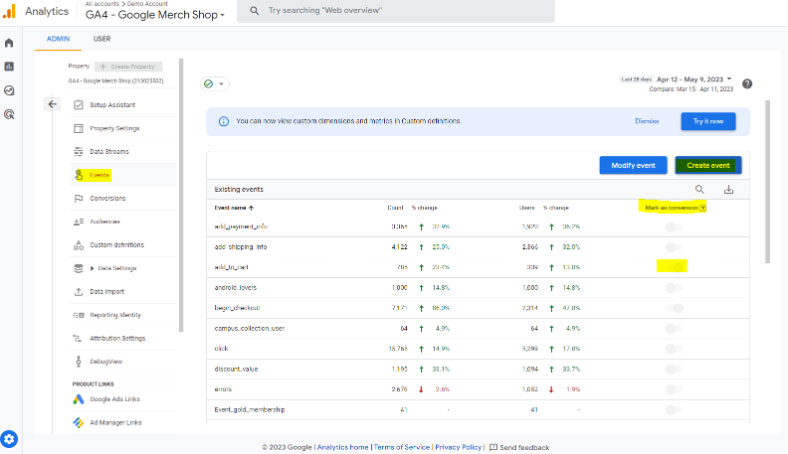 Please note that creating an event does not get applied to historical data, only events captured moving forward.
 - Open up the reports tab
- Select ‘engagement’ and then the sub-category of ‘conversions’
- Select the appropriate conversion to filter down to form fill conversion recently created
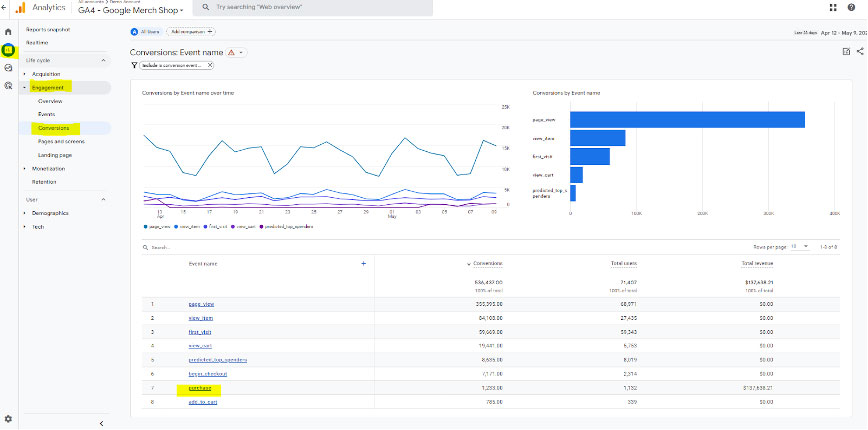
From this view, users can:
- Filter the data down further based on out-of-the-box and custom dimensions in your organization’s GA4 platform
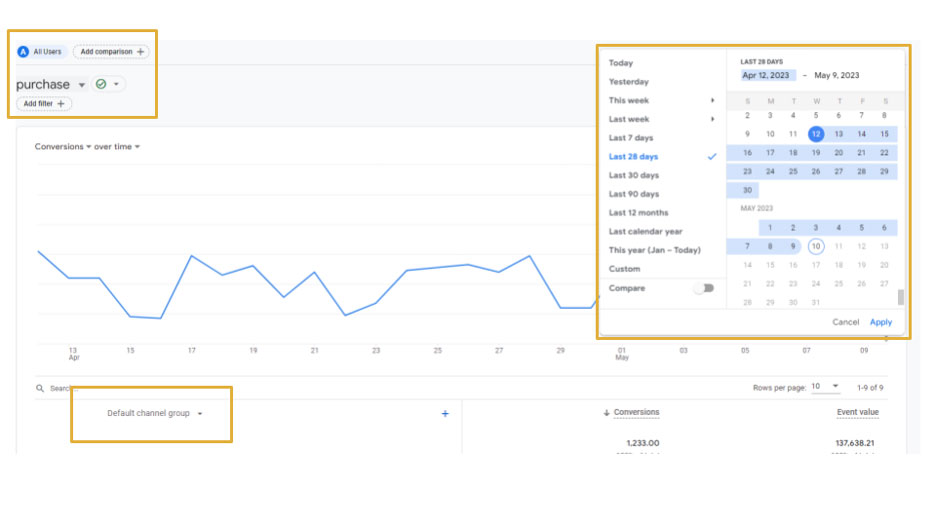
- Filter by date ranges to gather and compare data for
- Hand-raisers per year
- Hand-raisers per quarter
- Hand-raisers per month
- Hand-raisers per weekday (even flexible on the start date for the week!)
- Group the data collected by specific event criteria to see what medium, campaign, or source is generating the highest quantity
 For a more customized report in GA4, view the video below!
Marketo Report
Reporting in Marketo can seem daunting because it has limited capabilities. It is a marketing automation platform at its core, not an analytics platform. However, there are great insights that one can glean from the platform to support the analysis of hand-raisers.
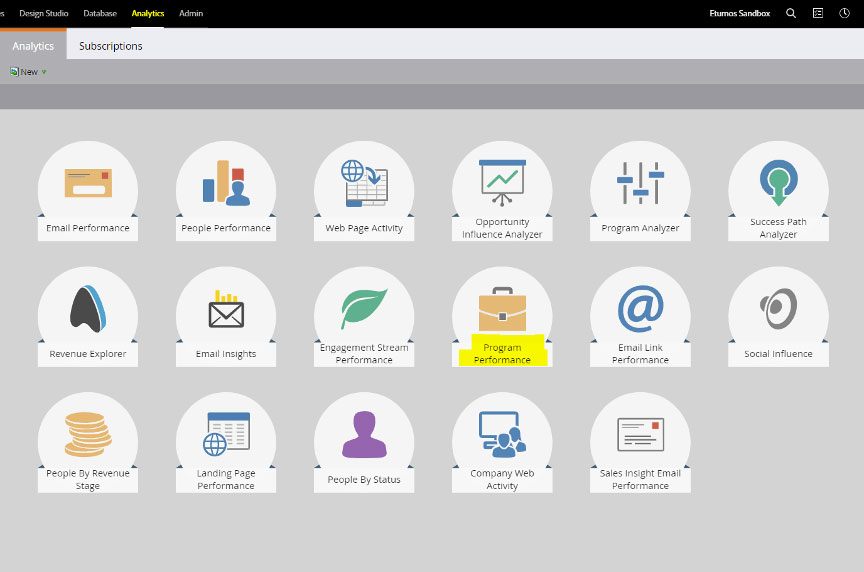
Setup a program performance report for the hand-raiser programs:
- Analytics
- Program performance
- Setup > Drag in the program filter and select your organization’s hand-raise programs
At a high level, this report will demonstrate:
- How many hand-raisers your organization has collected to-date
- How many of those hand-raisers were new persons (first time filling out a form on your site)
- Successes, if your team has specific success statuses associated after the form fill
- Cost per person (form fill), if your team is using period costs for your hand-raiser programs
Customization options:
- Use of Marketo tags to understand what teams are generating the engagements or firmographic/demographic information
- Cost analysis to understand what marketing costs are being input to generate the hand-raisers
Salesforce Report
All screenshots are produced through the Salesforce Developer account
The reporting in this section is built with the expectation that your MAP is passing the hand-raiser engagement to a campaign in Salesforce as a campaign member.
Set up a report for tracking hand-raisers overtime:
- Reports
- New Report
- Search for the campaign with campaign members
- Filters:
- Campaign Name = ‘campaign capturing hand-raiser form fills
- Date = ‘campaign member created date’ or ‘has responded date’ depending on what status in the campaign is identifying the form fill
- Outline
- Group by the appropriate member status date that matches your date range
- Add fields that you may want to report further on. For example
- Account name
- Account side
- Job title
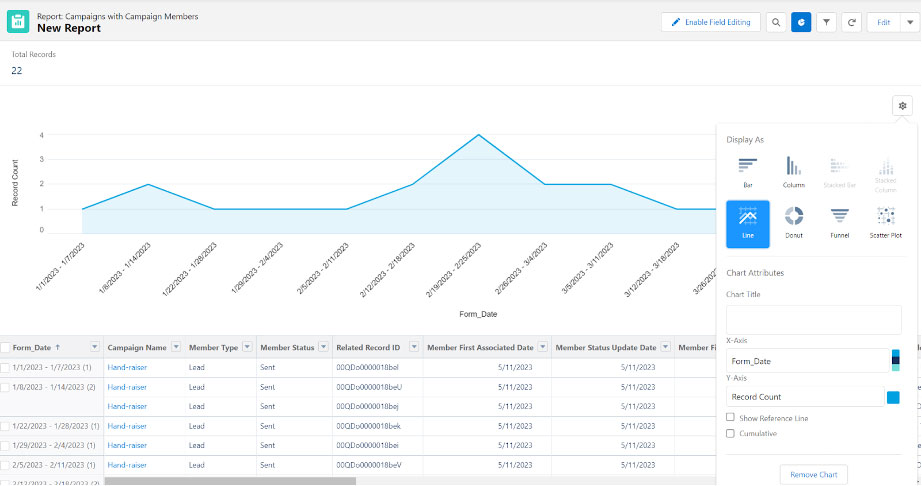
- Select the chart in the top right-hand bar
- Click chart properties
- Select ‘line’
- X-axis = date grouping field
- Y-axis = record count
 Customizations options:
- Pull in campaign costs to calculate the cost per form-fill if collecting
- Add additional grouping customizations depending on specific demographic or firmographic information your organization is collecting
- If your team is passing UTM information in at the campaign member level, group by the UTM data capture to see where the prospects are coming from to fill out the form
- Create a campaign influence on the opportunity if your team is associating a campaign with every opportunity generation to calculate ROI or impact on pipeline and revenue
- Change by date ranges and group by criteria to gather and compare data for
- Hand-raisers per year (group by year)
- Hand-raisers per quarter (group by quarter)
- Hand-raisers per month (group by month)
- Hand-raisers per weekday (group by week)