Lead Quality Acceptance Rate Report
The Lead Quality Acceptance Rate (Known>MAL) Report shows the rate at which a person is moving from being a record in your system to being qualified for marketing initiatives. Simply put they are a record that is now eligible for nurturing and marketing initiatives.
- Known – a person in your system that provided their information
- MAL – leads have been qualified based on demographic scoring—philosophically, they’re leads who you’re interested in as a company, as they’d be a good fit as a customer and would be able to pay for your product or services
High-level what is the report revealing:
When a lead is known they are not necessarily engaging with your organization’s marketing content or they may not be the ideal target audience for your product. That’s why it is important to understand the rate at which they become a MAL because it helps to lay the groundwork for understanding who is in your database and when they are ready or how long it takes for them to become ready for marketing initiatives.
Marketing Data Analyst’s Perspective:
This report will identify what information you are collecting on leads and whether or not the information is supportive of marketing initiatives and is of quality data to continue through the cycle. Furthermore, it can showcase trends over time to understand what campaigns/content pieces are best at driving a known person to be qualified for marketing initiatives. It can provide insights into discrepancies between a target audience and persons actually engaging with the content and keep bad leads away from entering your nurture programs.
This report (as you will see in the examples below) can be further developed to dive into overall funnel metrics for your organization’s lifecycle process. To learn more about setting up the lifecycle process and optimizing your MAPs process for lifecycle tracking, read more here, here, and here.
Recommended Field Requirements for Data Capture and Analysis
Required fields for analysis:
- Lifecycle status: pick-list field
- Date of the lifecycle for each stage: Date field
- Date – Stage: MAL
- Date – Stage: MEL
- Date – Stage: MQL
- Date – Stage: SAL
- Date – Stage: SEL
- Date – Stage: SQL
- Date – Stage: MRL
- Date – Stage: SRL
- Date – Stage: Customer
- Date – Stage: Disqualified
- Additional demographic information to slice and dice the records for analysis:
- Employee size
- Account Name
- Account Type
- Product Interest
Tableau Dashboard Funnel Example
*note that the data in this dashboard is entirely fake data
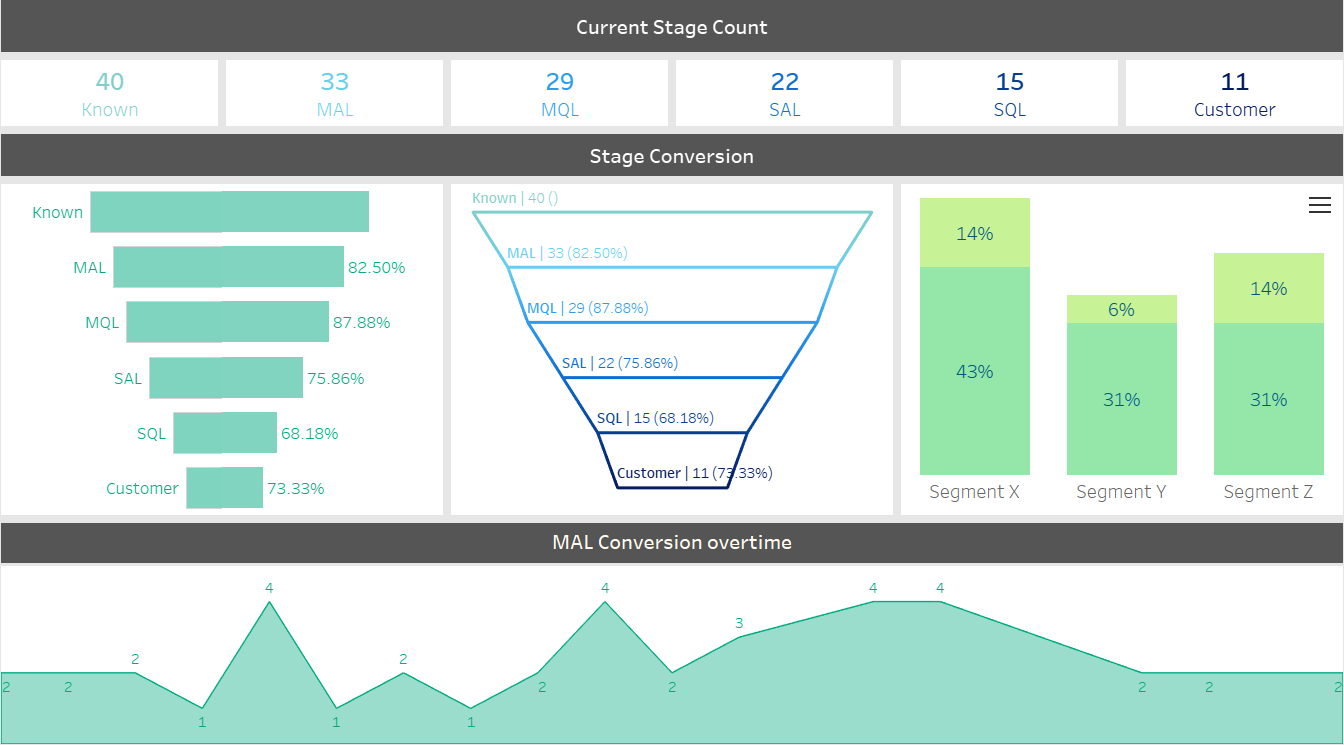
Now for the fun part, actually building the funnel and understanding the conversion rate.
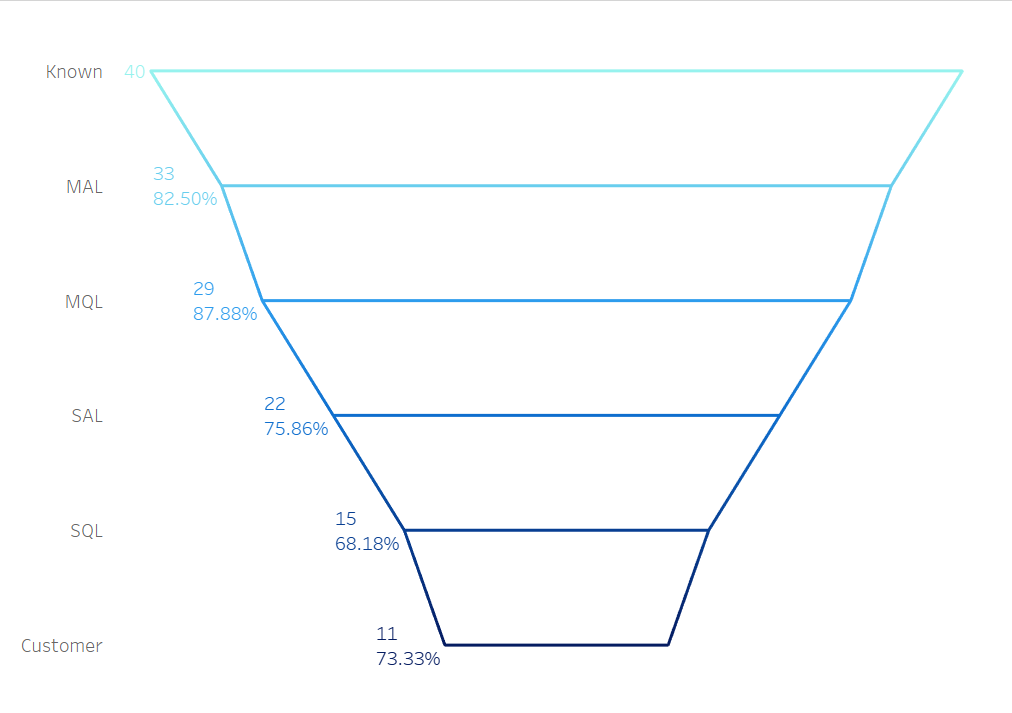
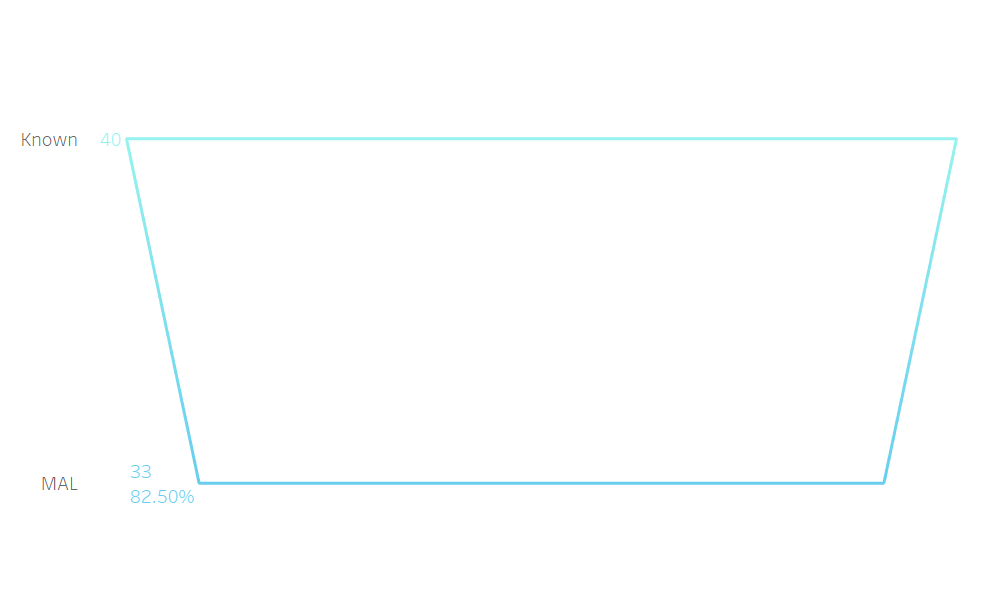
The chart shown above is showing a full lifecycle funnel but each dashboard tile can be paired down to show the conversion from a known person to a MAL-qualified person.
The goal of this report is to understand who are known persons and who are MAL persons and at what rate over time they are converting to MAL. So the data set used in the dashboard is pulling all the person records, their current lifecycle status, and segment information (to represent demographic information).
Data Manipulation in Tableau
Since the lifecycle field was a pick-list value, I needed to generate a calculated field in Tableau to extrapolate the number of folks that made it past each stage. For example, every person’s record with a stage name that is anything other than “known” can be interpreted as having been “known” at a point in time.
Tableau Calculation thought-out Logic:
- Known = total distinct count of person IDs
- MAL = total distinct count of person IDs minus distinct count of person IDs in stage known
- MQL = total distinct count of person IDs minus distinct count of person IDs in stage known and stage MAL
- SAL = total distinct count of person IDs minus distinct count of person IDs in stage known and stage
- MAL and stage MQL
- SQL = total distinct count of person IDs minus distinct count of person IDs in stage known and stage
- MAL and stage MQL and SAL
- Customer = total distinct count of person IDs minus distinct count of person IDs in stage known and stage MAL and stage MQL and SAL and SQL
Tableau Calculation for Funnel Count on Each Stage
| IF [Stage Name] = “known” THEN { FIXED : COUNTD([Person ID]) } ELSEIF [Stage Name] = “MAL” THEN { FIXED : COUNTD([Person ID]) } – { FIXED : COUNTD( IF [Stage Name] = “known” THEN [Person ID] END)} ELSEIF [Stage Name] = “MQL” THEN { FIXED : COUNTD([Person ID]) } – { FIXED : COUNTD( (IF [Stage Name] = “known” then [Person ID] ELSEIF [Stage Name] = “mal” THEN [Person ID] end))} ELSEIF [Stage Name] = “SAL” THEN { FIXED : COUNTD([Person ID]) } – { FIXED : COUNTD( (IF [Stage Name] = “known” then [Person ID] ELSEIF [Stage Name] = “mal” THEN [Person ID] ELSEIF [Stage Name] = “mql” THEN [Person ID] END))} ELSEIF [Stage Name] = “SQL” THEN { FIXED : COUNTD([Person ID]) } – { FIXED : COUNTD( (IF [Stage Name] = “known” then [Person ID] ELSEIF [Stage Name] = “mal” THEN [Person ID] ELSEIF [Stage Name] = “mql” THEN [Person ID] ELSEIF [Stage Name] = “sal” THEN [Person ID] end))} ELSEIF [Stage Name] = “Customer” THEN { FIXED : COUNTD([Person ID]) } – { FIXED : COUNTD( (IF [Stage Name] = “known” then [Person ID] ELSEIF [Stage Name] = “mal” THEN [Person ID] ELSEIF [Stage Name] = “mql” THEN [Person ID] ELSEIF [Stage Name] = “sal” THEN [Person ID] ELSEIF [Stage Name] = “sql” THEN [Person ID] end))} END |
To generate both sides of the funnel another calculator was needed that was the negative of the funnel calculation:
| -[Full Lifecycle Count] |
I also generated specific calculations that provide a total count for each stage to have if needed for other calculations:
- Known
- MAL
- MQL
- SAL
- SQL
- Customer
From there I generated a bar graph made up of lines to create a funnel:
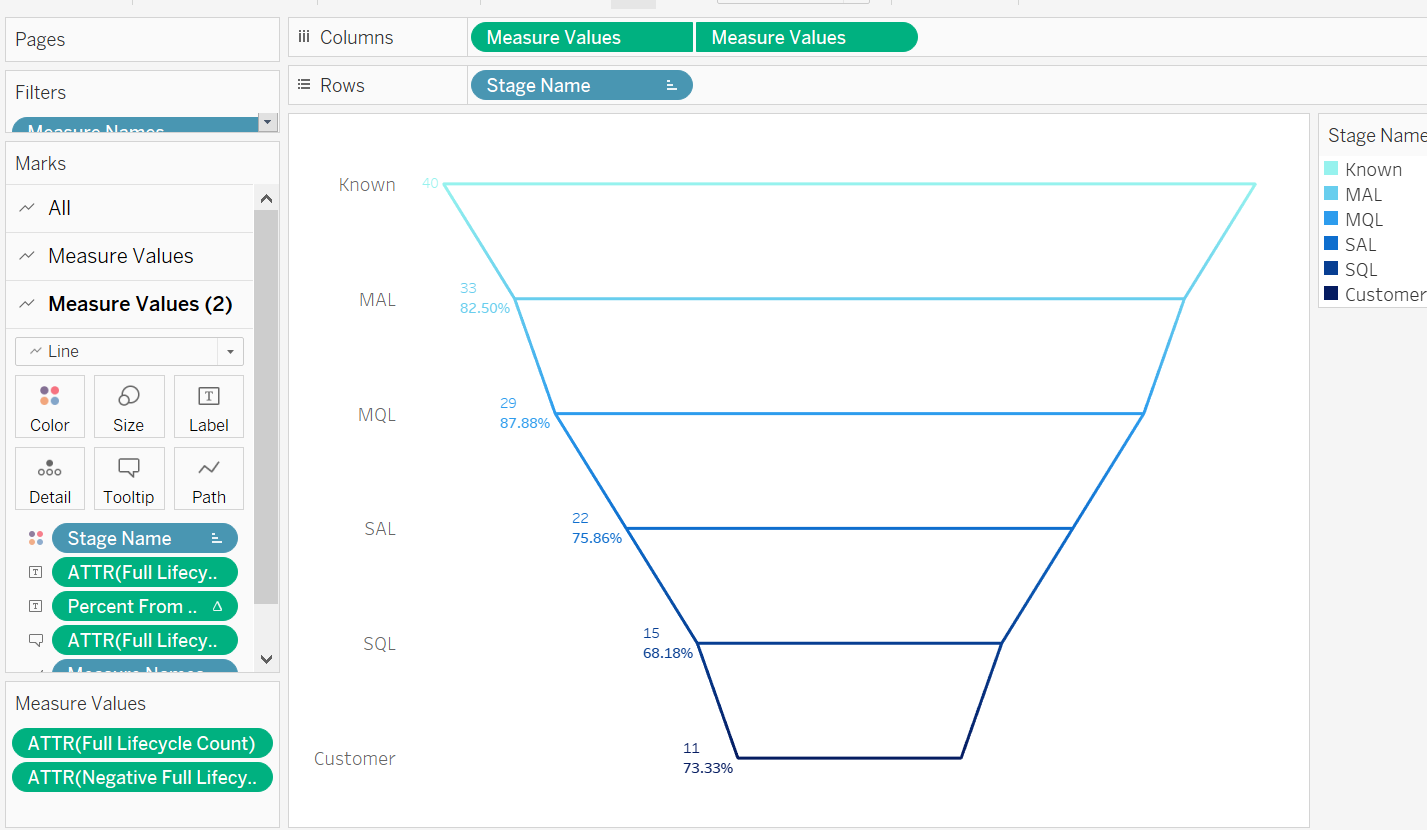
Measure Values:
- Full Lifecycle Count Field
- Negative Full Lifecycle Count Field
- Columns (dual-access)
- Measure Value
- Measure Value
- Rows:
- Stage Name
Marks
- All:
- Color = Stage Name
- Tooltip: Full Lifecycle Count
- Measure Value (1):
- Color = Stage Name
- Detail = Measure Name
- Measure Value (2):
- Color = Stage Name
- Text = Full Lifecycle Count
- Text = Percent From Table Calculation to show conversion (table down)
- Path = Measure Names
Additional Reports
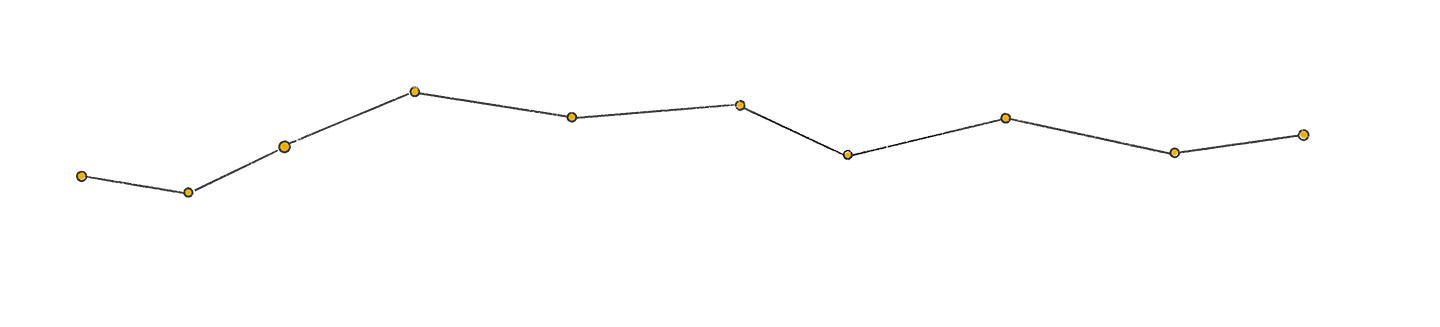
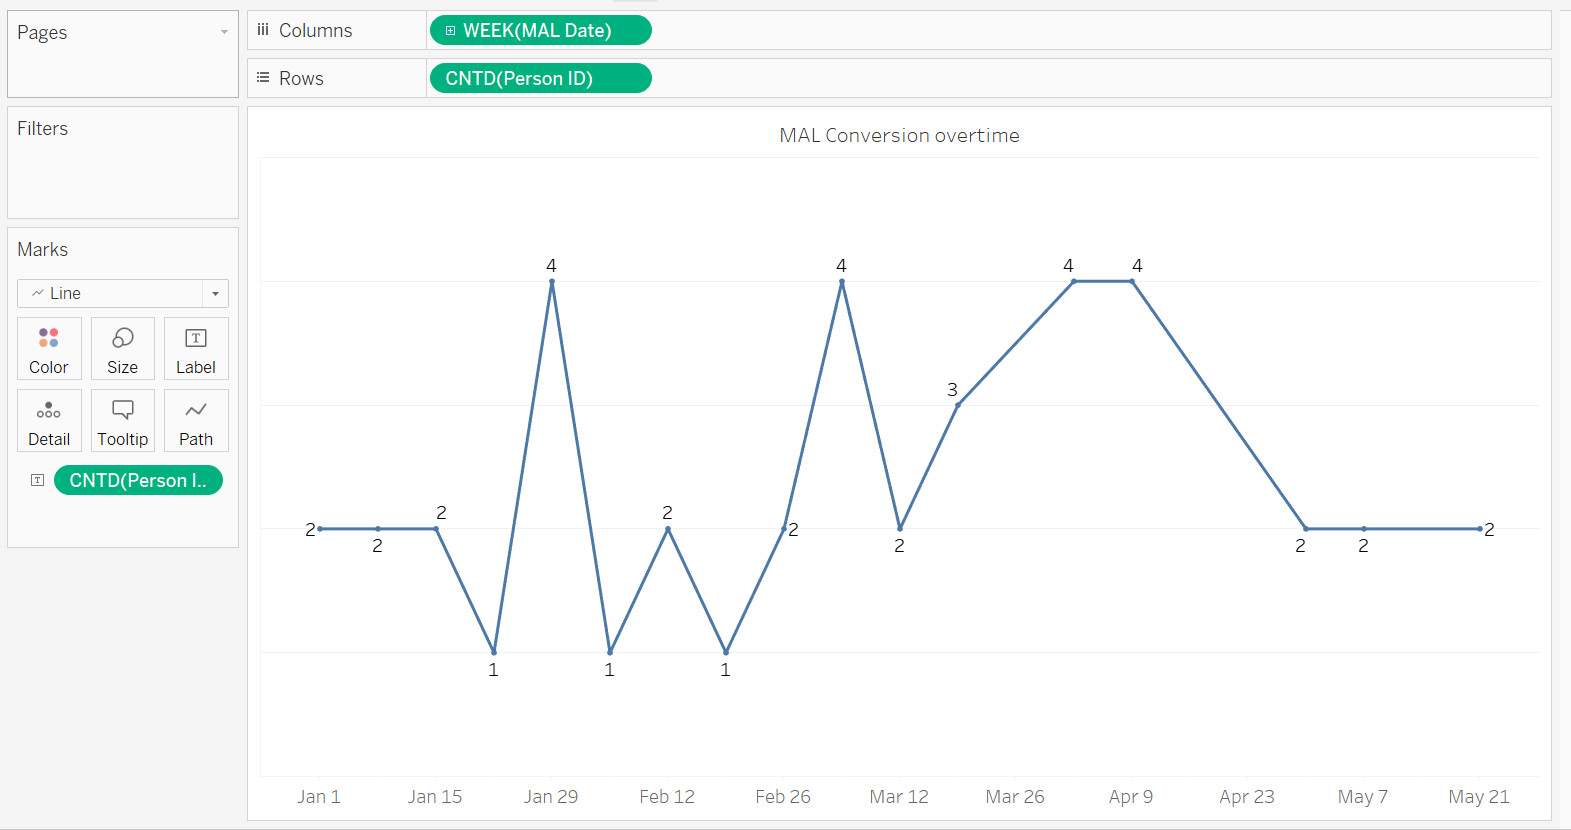
Track MAL Conversion overtime
This will help identify trends in periods that a record is more or less likely to convert to a MAL and identify if the organization is bringing records that are an appropriate fit for the product.
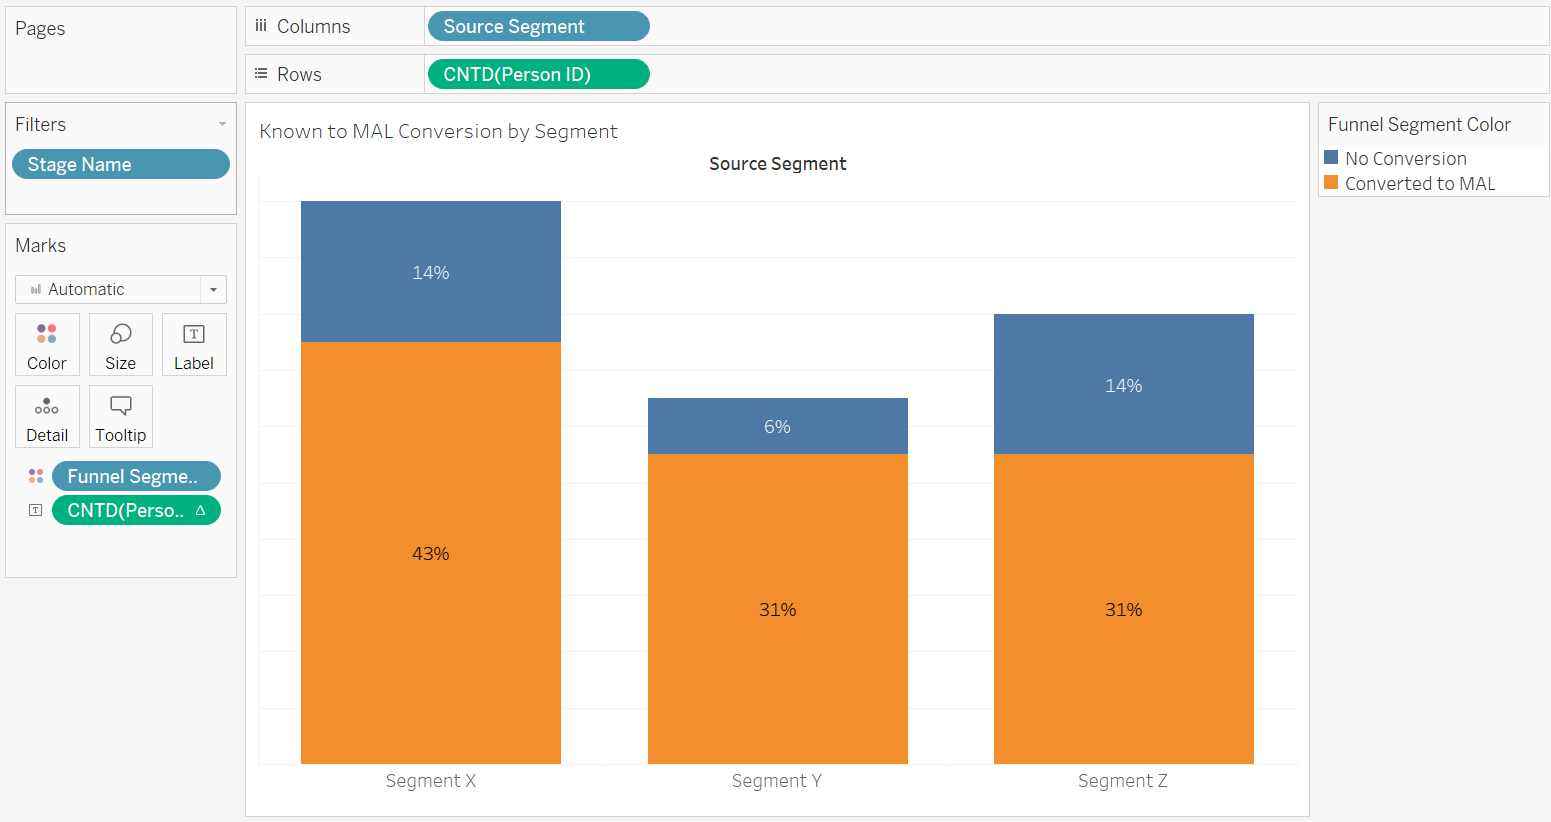
Conversion to MAL by Segment
This chart shows if a particular segment (demographic information or could be person source information) is best at converting a record to a MAL.
Putting it together
Eventually when you have determined what questions your team is trying to answer:
- Conversions overtime
- Conversion rate
- Conversion by Segment
You can put it together to develop a dashboard with additional filters and drill-down information to allow a user more autonomy on pulling their own information to gather insights, such as:
- Date criteria
- Segment criteria
- Engagement criteria
Example sample CSV data
How to interpret and act on the information from the report
Interpreting the data can be the most tricky part. It’s essential the team has enough data to accurately extract insights in act upon them; as statistically significant. Once you have that confidence, the team can start looking at trends.
For example in the overtime chart, year over year or quarter over quarter, is the MAL conversion count always spiking during a certain month or aligned with certain marketing initiatives or promotions? This should lead to further drill-downs to understand what promotions were being run then and why those resonated with the MAL audience.
In the line funnel chart, this should be aligned with KPIs. If the team is identifying that the count of persons entering a nurture program is decreasing, it’s essential to see if the conversion rate from Known to MAL is decreasing or if the overall count of known records is decreasing. If the conversion rate is decreasing and the team is not qualifying enough known records to MALs to qualify for nurture campaigns, then it might be time to review the MAL conversion criteria to see if the scoring or target audience should be adjusted.
The data and analysis are starting points for the team to make informed decisions. It’s helpful for identifying trends over time and dips in data. It should support questions that the team is looking to answer. This analysis should help to provide more strategic discussions and better arm your whole Marketing Team to be data-driven on the data that is being received.