Overview
In today’s data-driven marketing landscape, having clear, actionable insights is crucial. Marketers often juggle multiple platforms that involve email campaigns, website analytics, ad performance, etc. making it difficult to see the full picture. Here’s where Looker Studio can provide some major benefits. Looker Studio is Google’s data visualization and reporting tool, and is designed to simplify data analysis and bring clarity to complex marketing operations. With both a free and a paid version (Looker Studio Pro) available, you’ll be able to decide which version makes sense for your team. Regardless of what you chose though, utilizing Looker Studio can provide valuable insights and help your organization make impactful data-driven decisions.
What is Looker Studio?
Looker Studio (formerly Google Data Studio) is a cloud-based platform that connects to your data and transforms it into visually appealing, interactive dashboards and reports. Instead of digging through spreadsheets or switching between different platforms, Looker Studio centralizes your data in one place, offering real-time insights that update automatically as new data flows in.
Whether you’re a marketer, analyst, or business owner, Looker Studio helps you easily understand performance metrics, track KPIs, and make data-backed decisions without needing to write complex code or export files manually.
How Does Looker Studio Work?
At its core, Looker Studio works by connecting directly to your data sources. It supports a wide range of integrations such as Google Analytics, Google Ads, Google Sheets, BigQuery, and can also integrate with Marketo, using a third-party data connector like Skyvia or SyncHub where data is extracted from Marketo, stored in a data warehouse, and then transferred to Looker Studio. Once connected, you can create reports by dragging and dropping components like charts, tables, and scorecards. You can customize these visualizations to highlight important trends, calculate new metrics with formulas, and filter data by date ranges or campaign segments. Interactive features allow report viewers to drill down into the details or adjust filters themselves, making insights more accessible across teams. The reports are web-based and easy to share via links or embedding on dashboards, enabling seamless collaboration without the need for additional software.
New to Looker Studio?
Here is a step-by-step guide for beginners first using the platform.
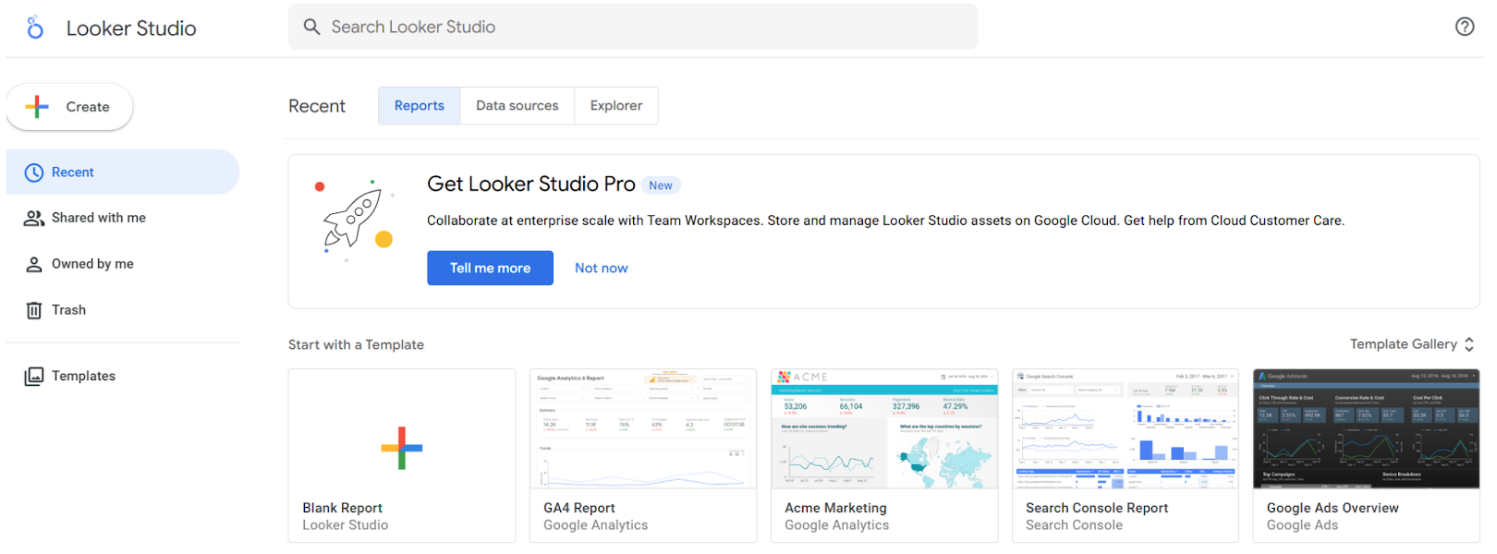
Step 1: Accessing Looker Studio
- Sign in with your Google Account: Visit https://lookerstudio.google.com and sign in with your Google credentials.
- Navigate the Home Page: Once you’re signed in, you’ll be on the home page. Here you’ll find a list of all your existing reports, a template gallery to get started quickly, and options to create a new report or data source.
Step 2: Creating a New Report and Connecting Data
- Start a New Report: On the home page, click on Create and select Report or simply click on Blank Report in the template section.
- Add Data: A panel will open asking you to “Add data to report.” This is where you connect your data sources. Looker Studio offers a wide variety of connectors, including:
- Google products like Google Analytics, Google Sheets, Google Ads, and YouTube Analytics.
- Databases like BigQuery, MySQL, and PostgreSQL.
- Flat files like CSV uploads.
- Social media platforms like Facebook and Twitter (through partner connectors).
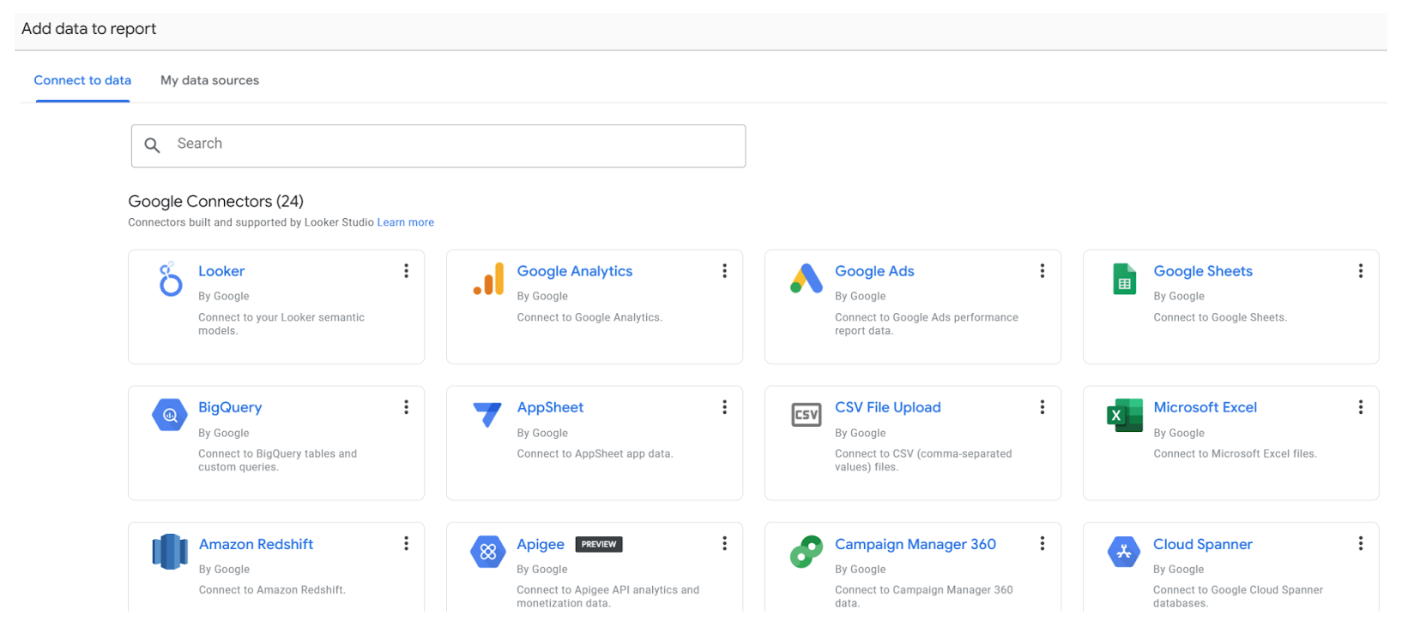
- Choose Your Data Source: For this example, we’ll use Google Sheets.
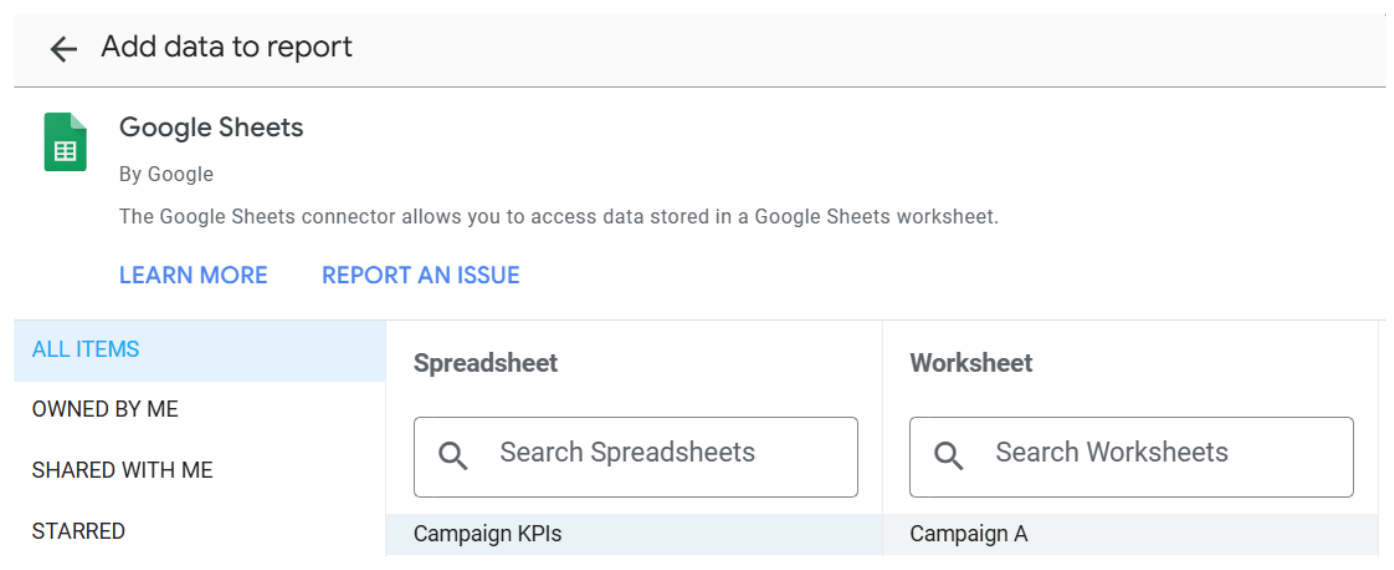
- Select the Google Sheets connector.
- Follow the prompts to authorize Looker Studio to access your Google Sheets.
- Select the spreadsheet and the specific sheet you want to use.
- Click Add to add the data source to your report. A table will be automatically placed on your canvas, populated with data from your spreadsheet.
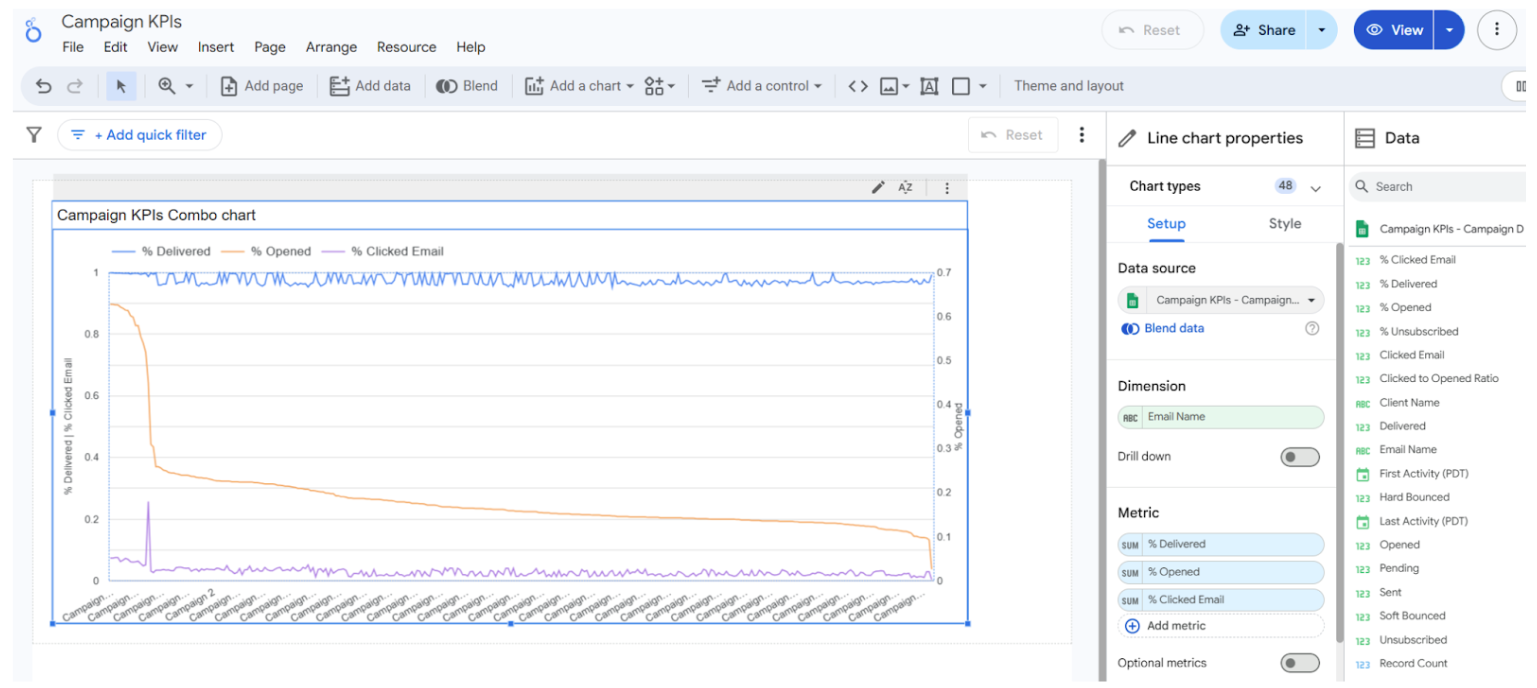
Step 3: Understanding the Report Editor
The report editor is where you’ll spend most of your time building your dashboard. Key components include:
- Toolbar: At the top, you’ll find tools to add charts, controls, shapes, text, and images.
- Canvas: This is the main area where you’ll place and arrange your charts and other report elements.
- Properties Panel: On the right side, this panel appears when you select an element on the canvas. It allows you to customize the data (dimensions and metrics), styling, and other settings for that specific element.
- Data Panel: To the right of the properties panel, you’ll see a list of the data sources and their available fields (dimensions and metrics).
Step 4: Adding and Customizing Charts
- Add a Chart: In the toolbar, click Add a chart. Choose the type of chart you want to use, such as a bar chart, line chart, or scorecard.
- Place the Chart: Click on the canvas where you want the chart to appear. A new chart will be added.
- Configure the Data: With the new chart selected, use the properties panel on the right to configure the data:
- Dimensions: These are qualitative data, often text, used to describe and classify your data (e.g., “Product Category” or “Country”).
- Metrics: These are quantitative data, numbers that can be measured (e.g., “Sales” or “Number of Users”).
- Drag and drop fields from the data panel onto the Dimension and Metric sections in the properties panel to populate your chart.
- Style the Chart: Click the Style tab in the properties panel to customize the appearance of your chart. You can change colors, fonts, legends, and other visual elements.
Step 5: Adding Interactive Controls
Interactive controls allow users to filter the data on your report.
- Add a Control: In the toolbar, click Add a control. Select a control type, such as a Date range control or a Dropdown list.
- Place and Configure: Place the control on your canvas. Use the properties panel to link it to the relevant data field. For example, a dropdown list might be linked to a “Product Category” field, allowing viewers to filter the entire report by a specific category.
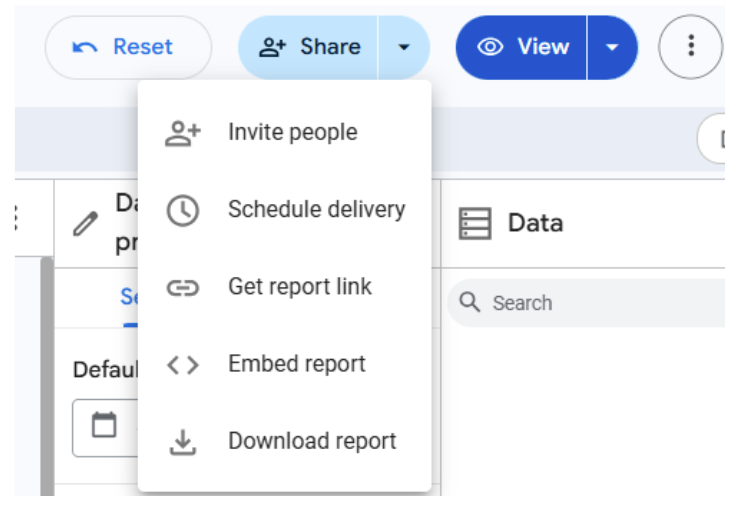
Step 6: Sharing Your Report
Once you’ve built and styled your report, you can share it with others.
- Click Share: In the top right corner of the report editor, click the Share button.
- Choose Sharing Options: You can share your report in several ways:
- Invite others: Enter email addresses and set “Can View” or “Can Edit” access.
- Get a link: Generate a link to share with others.
- Embed: Get the code to embed the report on a website or blog.
- Schedule email delivery: Set up a recurring email to send a PDF version of the report to specific recipients.
Use Cases for Looker Studio
Email marketing and broader marketing operations involve managing multiple campaigns, channels, and customer touchpoints. Having a unified view of this data is essential but often challenging. Below are some key features of Looker Studio:
- Email Performance: Email marketers can connect their platforms (like Marketo, HubSpot, or other email service providers) through connectors or by exporting data into Google Sheets, then visualize open rates, click-through rates, conversions, and more—all in one dashboard. This eliminates the need to log into multiple tools to track KPIs.
- Real-Time Data Updates: With Looker Studio’s live connections, your dashboards reflect the most current campaign data. This allows marketing teams to pivot strategies quickly if a campaign is underperforming or to double down on successful efforts.
- Cross-Channel Attribution: Your marketing ops team may need to see how specific email campaigns impact website traffic, ad conversions, or sales pipelines. Looker Studio can pull data from Google Analytics, CRM systems, and advertising platforms alongside email metrics, to provide a comprehensive view of customer journeys and ROI.
- Custom Metrics and Segmentation: You can create calculated fields to measure specific KPIs unique to your campaigns, such as revenue per email sent or engagement by subscriber segment. This granular insight helps tailor campaigns to different audience groups and optimize targeting.
- Easy Sharing and Collaboration: Reports can be shared with stakeholders or clients through simple links with customizable permissions. This transparency fosters collaboration and ensures everyone is aligned on campaign results without sending an overkill of documentation or static PDFs.
Looker Studio’s versatility makes it an invaluable tool that can be used in the following ways:
- Holistic Campaign Performance Dashboards: Combine data from Google Ads, Facebook Ads, Google Analytics, and your email marketing platform into a single dashboard. This allows you to track the entire customer journey, from initial ad impression to website conversion and email engagement, providing a comprehensive view of campaign effectiveness and ROI across channels.
- Website Performance and SEO Reporting: Create detailed reports pulling data directly from Google Analytics and Google Search Console. Visualize website traffic trends, top-performing landing pages, bounce rates, organic search rankings for target keywords, and user demographics. This helps identify areas for SEO improvement and content optimization.
- E-commerce Sales and Customer Behavior Analytics: Connect your e-commerce platform’s data (e.g., Shopify, often exported to Google Sheets or BigQuery) with Google Analytics to build dashboards that show sales trends, average order value, popular products, customer lifetime value, and conversion funnels. This empowers you to identify purchasing patterns and optimize your online store.
- Social Media Performance Tracking: While direct connectors for all social media platforms might vary, you can export data from platforms like Facebook, Instagram, or LinkedIn into Google Sheets. Then, use Looker Studio to visualize key metrics such as follower growth, engagement rates, reach, and clicks, allowing you to assess the effectiveness of your social media strategy.
- Content Marketing ROI Measurement: Track the performance of your blog posts, videos, and other content assets. By integrating Google Analytics data (page views, time on page) with conversion data (e.g., leads generated from a content offer tracked in a CRM and exported to Google Sheets), you can demonstrate the ROI of your content marketing efforts.
- A/B Testing Analysis: If you’re running A/B tests on your website or email campaigns, you can pull the results into Looker Studio. Create visualizations comparing the performance of different variations (e.g., conversion rates for different landing page designs or open rates for different email subject lines) to quickly identify winning strategies.
- Automated Client Reporting: Agencies can leverage Looker Studio to create automated, real-time reports for their clients. By setting up dynamic date ranges and client-specific filters, agencies can provide transparent and always-up-to-date performance dashboards without the manual effort of compiling reports every week or month.
- Budget vs. Performance Tracking: Combine your marketing spend data (from Google Ads, Facebook Ads, etc., or even a simple Google Sheet) with performance metrics. Create dashboards that visualize how your budget allocation correlates with key performance indicators, helping you optimize spending for maximum impact.
Conclusion
In an era where marketing success depends on quick, data-driven decisions, Looker Studio offers a user-friendly yet powerful solution. By centralizing data, providing real-time insights, and supporting deep customization, it empowers marketing operations teams to optimize campaigns, prove ROI, and ultimately drive better business outcomes—all without the need for heavy technical skills.
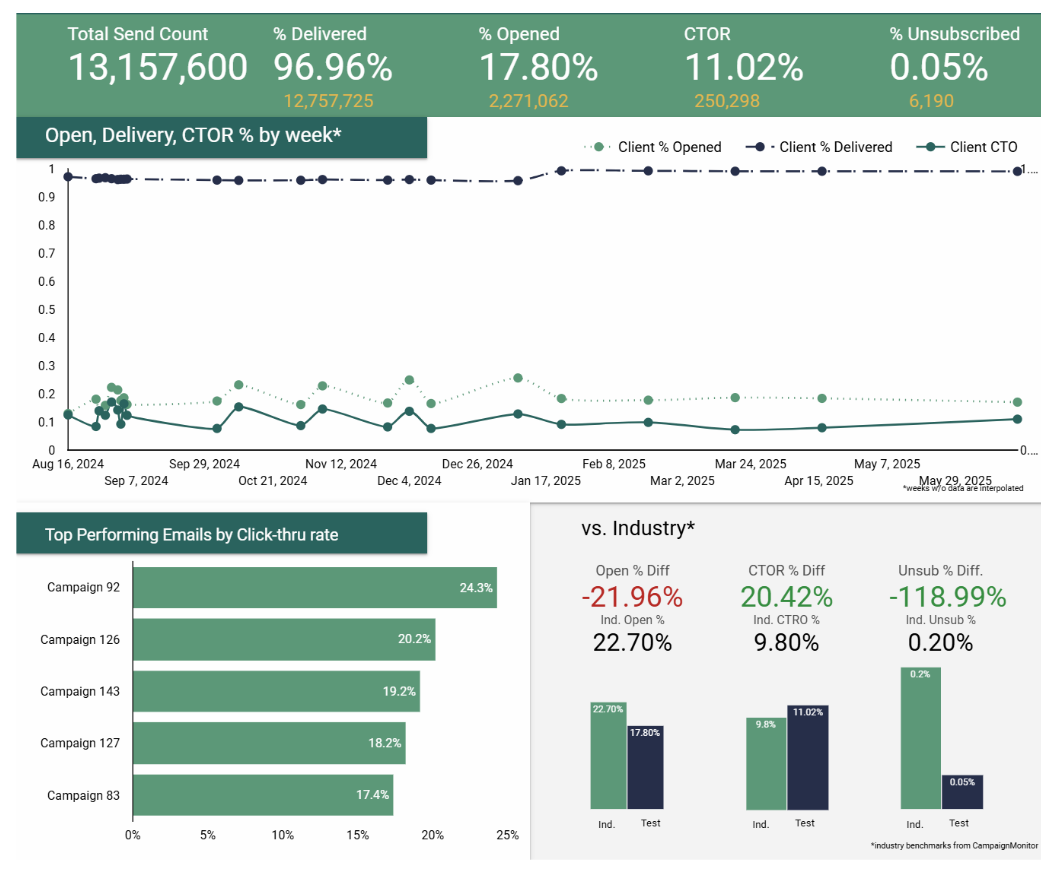
Etumos leverages Looker Studio to provide clients with a comprehensive email KPI dashboard, offering invaluable insights into their marketing campaign performance. This dashboard tracks key metrics such as delivered percentage, open rates, click-through rates, and unsubscribe rates. Also included in the dashboard are the top-performing campaigns, so it becomes abundantly clear what strategies have been working well for your team.
Employing this data-driven approach enables clients to gain a clear understanding of their current email marketing efforts and pinpoint areas for strategic improvement. If you’re looking to take control of your marketing data and make smarter decisions faster, Looker Studio is definitely worth exploring. Reach out to us today if you’d like help setting up your Looker Studio dashboard or would like to learn more about the various other services we provide!