Running a Tight Ship in GTM Operations
“Managers mistake operational effectiveness with strategy” Michael Porter
In your job, operational effectiveness across the customer lifecycle and within the funnel is your job. As long as it supports the strategy.
Running a tight ship is a great way to have a strong team. It’s especially important in GTM operations because of the pressures the business (marketing and sales) will put on us. Running a tight ship doesn’t mean having a bad culture or toxic culture, in fact it means the opposite. People on the team want discipline and focus while your stakeholders want to rely on you without worrying about it. So how do you get there?
Establish Strong Team Values
First, establish a few key values and how your team works.
- No Blame Culture
- Transparency breeds trust
- No work after 10pm. This isn’t the Army. This isn’t a hospital.
- Be responsive but not pushovers
- Prioritize and know how to do it.
- Emergencies are a team sport – everyone is on it or we don’t go ahead.
- Continuous improvement is a mindset
Process Management
Process is not a dirty word. The reason people resist processes is they weren’t part of the original design. Every business, every organization is a collection of processes and that’s a good thing! Those are repeatable actions that create value.
Of course, if a process isn’t creating value, that’s when it’s time to revisit it.
A good process has a good guardian
In Process Guard Theory, every process should have a person responsible for its outcomes. That person owns that process end to end. Including:
- Training new staff on the process
- Updating the process
- Monitoring the variance of that process
- Re-training staff
- Ensuring Process matches the needs of the business
- Raising awareness of the process and its impact.
Process Drift
Process drift occurs when too many people don’t use the process as intended. Often this occurs with lots of new staff entering the organisation. It can also occur when there isn’t a Guardian and the process becomes abandoned but still operates in some fashion. Sometimes the business moves on, no one told the Guardian, and people begin to complain about data or broken processes. Rarely does a process “break” but it does become out of date as reality and automation drift away.
To avoid Process Drift, it’s important to
- Document the process.
- Continuously train marketers.
- Continuously engage with teams who use or receive the outcomes.
- Tweak the process.
- Rebuild it when the business wants to move on.
When to watch out for Process Drift?
- Reorganizations
- Loss of key staff
- Change in strategy
- PLG motions adding Enterprise Sales
- A lot of new staff suddenly who are “used to my old company.”
Marketing Enablement
Part of training is Marketing Enablement, the lesser used sibling of Sales Enablement. Especially in large organizations, Marketers must receive continuous training, onboarding, and updates about the systems that help them run the funnel. That includes tools like
- Onboarding New Staff
- High level process charts
- How to Get XYZ Done here
- Documentation
- Clear ways to Prioritize requests so the loudest voice isn’t the winner.
Six Sigma
Six Sigma began at Motorola and was adopted by GE and Honeywell in the 1990s. It’s defined as
Six Sigma strategies seek to improve manufacturing quality by identifying and removing the causes of defects and minimizing variability in manufacturing and business processes.
Most programs attempt to reach 3.4 defects per million opportunities, or Five Nine Uptime. Six Sigma also borrows from Edward Deming and Japanese production tools like Kaizen.
And you can use them for ANY process, especially GTM funnels and systems.
Process Charts
Process charts are an operations team’s best friend. Make sure that your process charts run at the Executive level and a level down to specifications where you can engineer real solutions.
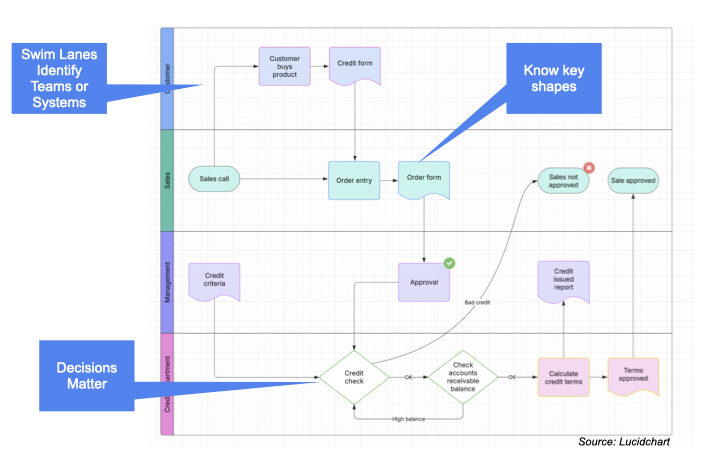
Know your key shapes, swim lanes, but you don’t have to make it more complicated than this.
- Square=a step or process
- Diamond=decision point – you can chain these!
- Page=web page
- terminator=End of Process
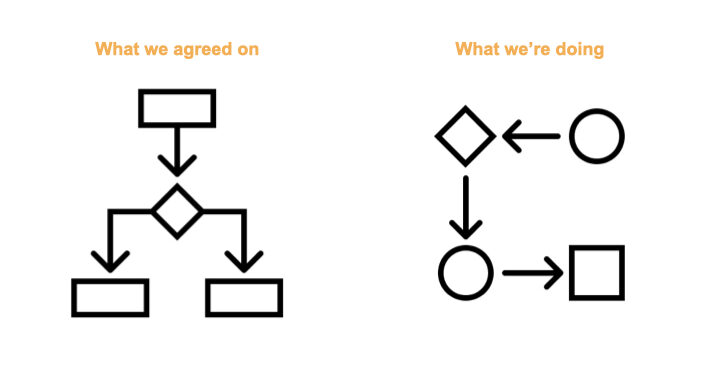
One mistake I see teams make is to assume a step or decision happens. It’s easy to do this because you want to go fast, but it does hide people and systems that should be exposed and looped into changes.
5 Whys
Five Whys is one of the most familiar tools for any troubleshooting or process analysis. It aims to get to a Root Cause of the situation so you can develop a solution.
The caveat to Five Whys is sometimes you need six Whys, especially if the answers weren’t very clear.
DMAIC
- Define – what’s the problem and scope?
- Measure – how do we know this?
- Analyze – what tools or ways do we know?
- Improve – what can be improved?
- Control – how do we monitor going forward?
Here’s a quick example:
- Define – what’s the problem and scope?
Direct Opps are changing to Direct Opps which impacts budget and bonuses. - Measure – how do we know this?
Our control variance chart shows this. - Analyze – what tools or ways do we know?
We have reports and data in our CRM. We spoke with salespeople as part of 5 Whys to understand the root cause. - Improve – what can be improved?
We can modify the compensation plan to ensure Salespeople are no longer doing this then create a new process with Deal Desk. - Control – how do we monitor going forward?
Update and monitor our control chart.
Variance Analysis
Variance analysis is a key part of developing a strong uptime culture as well as building better revenue forecasts. The lower the variation to reality, the better your forecast model, and therefore better the “predictability” of revenue.
Variance analysis is a critical tool in monitoring not just your system uptime also the funnel rates and revenue reports. In this example for API Calls, we can see:
- Upper Limit (UCL) when alerts go off.
- Lower Limit (LCL) when it’s too low we should be alerted.
- Mean – about where it has been, sometimes use Trailing Twelve Months (TTM).
- Actual (red) – what’s happening over time.
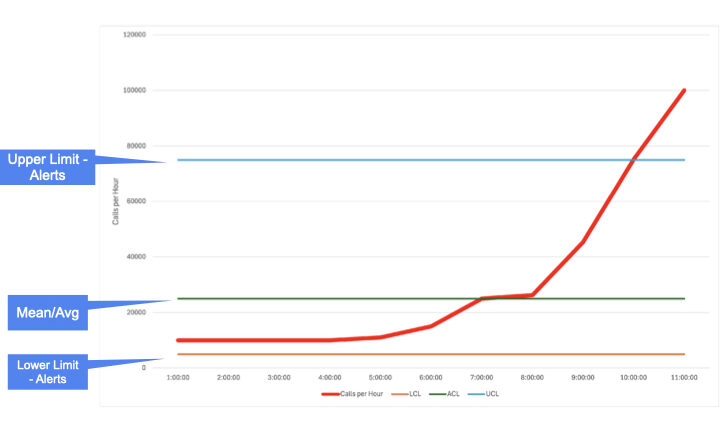
In this, very contrived case, we can see calls were quite low over several hours then rapidly spiked. Unless this was expected, we should be concerned and begin looking into this for a root cause.
Kaizen & Continuous Improvement
Kaizen comes from the Toyota Production System. The goal is continuous improvement of a process such as building a defect free car, or a defect free email campaign.
What it is
- Optimize everything
- No Waste
- Minimize Process Drift
- Empower the Line Worker
Kaizen in Action
Kaizen is a powerful tool to activate right now in your Campaign Operations motion.

- Monitor variation of the funnel and system health
- Quality Control and Checklists
- Empowered to Pull the Cord – see something say something.
As part of a No Blame culture, it’s important to emphasize that if a staff member sees a mistake during QA or an error before deployment that they speak up and Pull the Cord – halting deployment. Then the team or original builder fixes it and is approved to restart the line.
And if a mistake does impact others? Notify and escalate! Come to your manager with a solution option and work to get it fixed. Own it and the solution and people will want to keep working with you.
Stakeholders appreciate it when you care about the outcome and perfection. I’ve never had any complaints about delaying a campaign or project when we knew an error would cause problems. It is very acceptable to stop work until errors are resolved.
It is not acceptable to hide mistakes or let mistakes escape when you could have stopped them.
No Blame Culture in Action
Put your new ship in action right now. You don’t need fancy docs just yet. Incorporate these three items into your team’s DNA.
- No Blame Culture
- Pull the Cord
- Transparency
Proving Value
How do you know any of this is working? You can monitor and commit to certain KPIs as well as monitoring funnel health with your Revenue Analytics team.
Tactical Team KPIs
These are around operational or system processes that executives assume work.
- Production Error Rate
You can define this in a variety of ways. What works for many teams is an Error that would impact a customer or stakeholder beyond a simple typo. The goal is to reduce errors within a time period such as Under 5 Defects per Quarter in 1000 deployments (.05%) or Three Nines. - System Uptime
How many hours was a system or stack “down”? Or not delivering to agreed expectations. Make sure your vendors agree to an Uptime Commit. - Lead Flow Or User Uptime
Some large volume companies or ecommerce firms will look at Lead Flow and Speed To Lead as a metric. Every second may count in certain competitive scenarios. If Leads stop, Sales stops. This can be measured as Time a Lead takes to get between systems; time to first call; time leads aren’t delivered. - SLA Attainment
Are you delivering campaigns or projects against the original agreed SLA? Take caveats such as not being held to an SLA if stakeholders don’t approve or other mitigating circumstances. - Hours to Build
In Campaign Operations, templating and automation can compress the people hours required to build something, allowing you to produce more, or compress SLAs. For example, Templating Event in a Box better reduced hours from 15 to 5 and allowed SLA from 5 days to 2 days.
Strategic KPIs
Strategic KPIs are focused on revenue, costs, and ROI. And funnel metrics that impact the business. It’s perfectly fine to build and monitor these, just be careful when committing to owning a number as GTM Operations may not always directly impact revenue, for example.
- Cost or Revenue of a Process
What’s the cost to maintain funnel visibility or ABM?
Is the Click to Calendar process delivering any revenue? - Cost of an Error
If Lead Flow goes down, what’s the opportunity cost per hour? - Revenue Velocity
GTM Operations can impact velocity through Nurture programs as well as bringing on tools (like click to calendar) that reduce process time or communications. - ROI of a Project or Tool Deployment
The ROI of a Project is crucial to getting approval from executives as well as a key step in pruning your stack.
Remember, GTM Operations is a repeatable process that is monitored and optimized over time across teams and customers. The processes should serve the outcomes and strategy. And to do this effectively you need to leverage process and Six Sigma tools.